The Energy.Hub makes it easy to see what the “real” reasons for failure are, using a primary and secondary failure process. Understanding the issues that persist allows to target specific areas for improvement or identify trends that can save you money.
Bills can fail validation for a single reason; e.g. a line item has been charged at the wrong rate or due to a multitude; e.g. additional tariffs & missing consumption. Sometimes, a single failure issue will have a knock-on effect to other items and cause multiple reasons for failure (think consumption failure that causes the shadow bill to fail).
Going through big bills can make it difficult to see where the real issue lies. After all, shadow bill comparison can be a long process. For this reason, we have created a report to guide users to the “real” disputes of value & a Power BI visualisation to enable dispute tracking over time.
Primary & Secondary Report
The Primary & Secondary report makes it easy to identify where the primary failure issue lies, saving time during the validation process. For instance, it is often seen that consumption causes issues, which is something expected for the month if the metering heatmap was not healthy. The report will flag this and allow to look into other issues of value.
You can access the individual bill report in the Invoice screen by navigating to Bills >> Validation >> Validate Bills >> Select billing file >> Bucket Details Box & Primary Secondary Report.
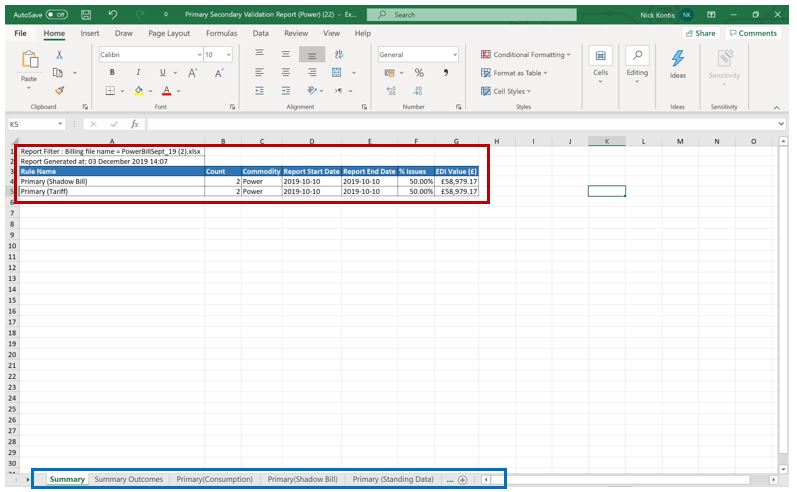
Once you are in the report, the Summary Tab will give you an overview of the primary disputes. Once you know the issues, you can navigate the tabs in the report to find out additional details on value and differences.
Alternatively, you can download the general report for your entire portfolio (all bills) by navigating to Reports >> Generate Report >> Validation >> Primary Secondary Report.
This report will help you understand your portfolio better, similar to the Billing KPI’s BI.
Tip: Download & save the report within the invoice for analysis and bench marking against the final results.This makes the data more manageable for larger portfolios.