The delivered cost of a KW can vary wildly in any single day, one key driver of this is the distribution costs. This report gives end users control over these costs, and the first step is being able to see when you are using energy in each DUoS time band.
We have created a new Red, Amber & Green Report (RAG), which allows Energy.Hub users to fully interrogate these costs.
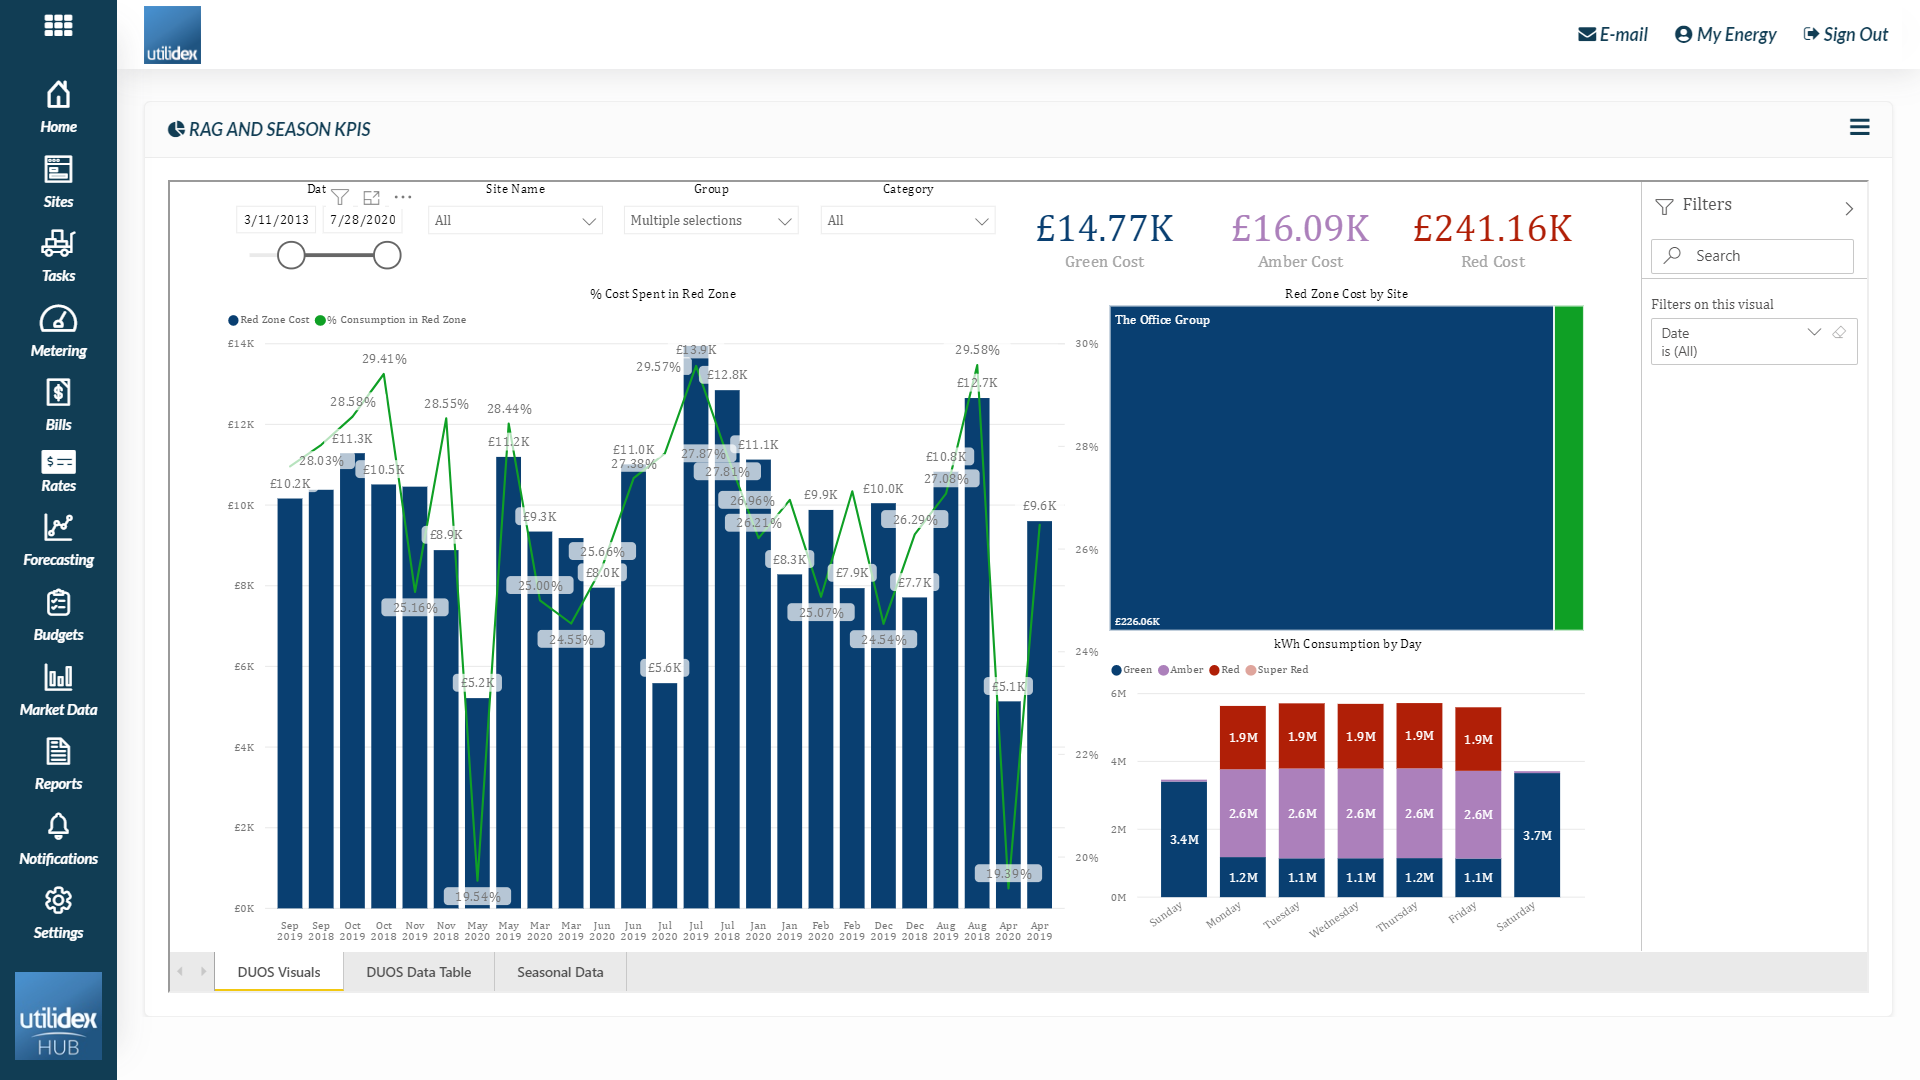
The BI is made of three main tabs:
- DUoS Visuals – This tab gives a graphical representation of the cost and consumption in Red, Amber and Green time zones
- DUoS Data Table – This tab gives a table of the cost and consumption in Red, Amber and Green time zones
- Seasonal Data – This tab gives a graphical representation of the cost and consumption depending on the specific season.