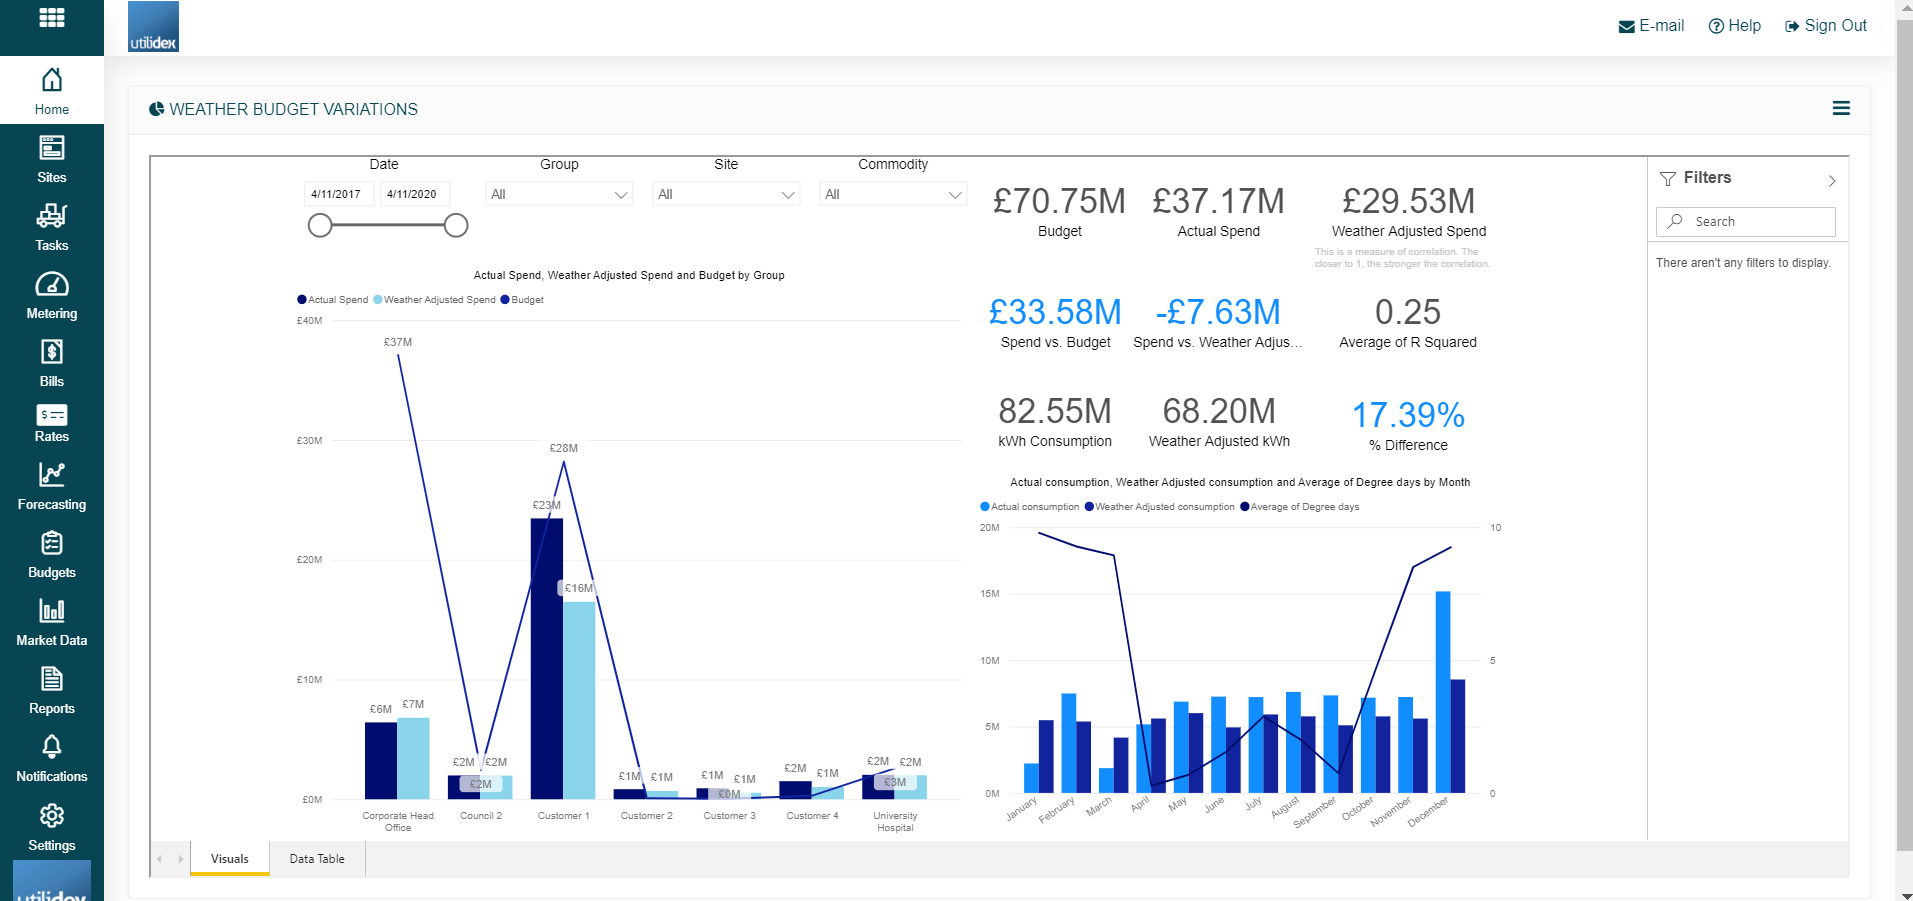
The Weather Budget Variations BI gives a graphical representation of your weather spend and consumption compared to your actual spend/consumption. The report compares your actual spend and consumption against weather adjusted figures as well as comparing against your set budget.
The BI is made of two tabs:
- Visuals – This tab provides a graphical representation and KPIs that gives you information on your actual and adjusted spend and consumption.
- Data Table – This tab provides you with the underlying data in the form of a table.