Manage Your Position and MtM Reporting
Along with the excel, there is a power BI for the Mark-to-Market reports. There are four tabs which display the underlying data.
Below is a screen shot of the Power MtM report:
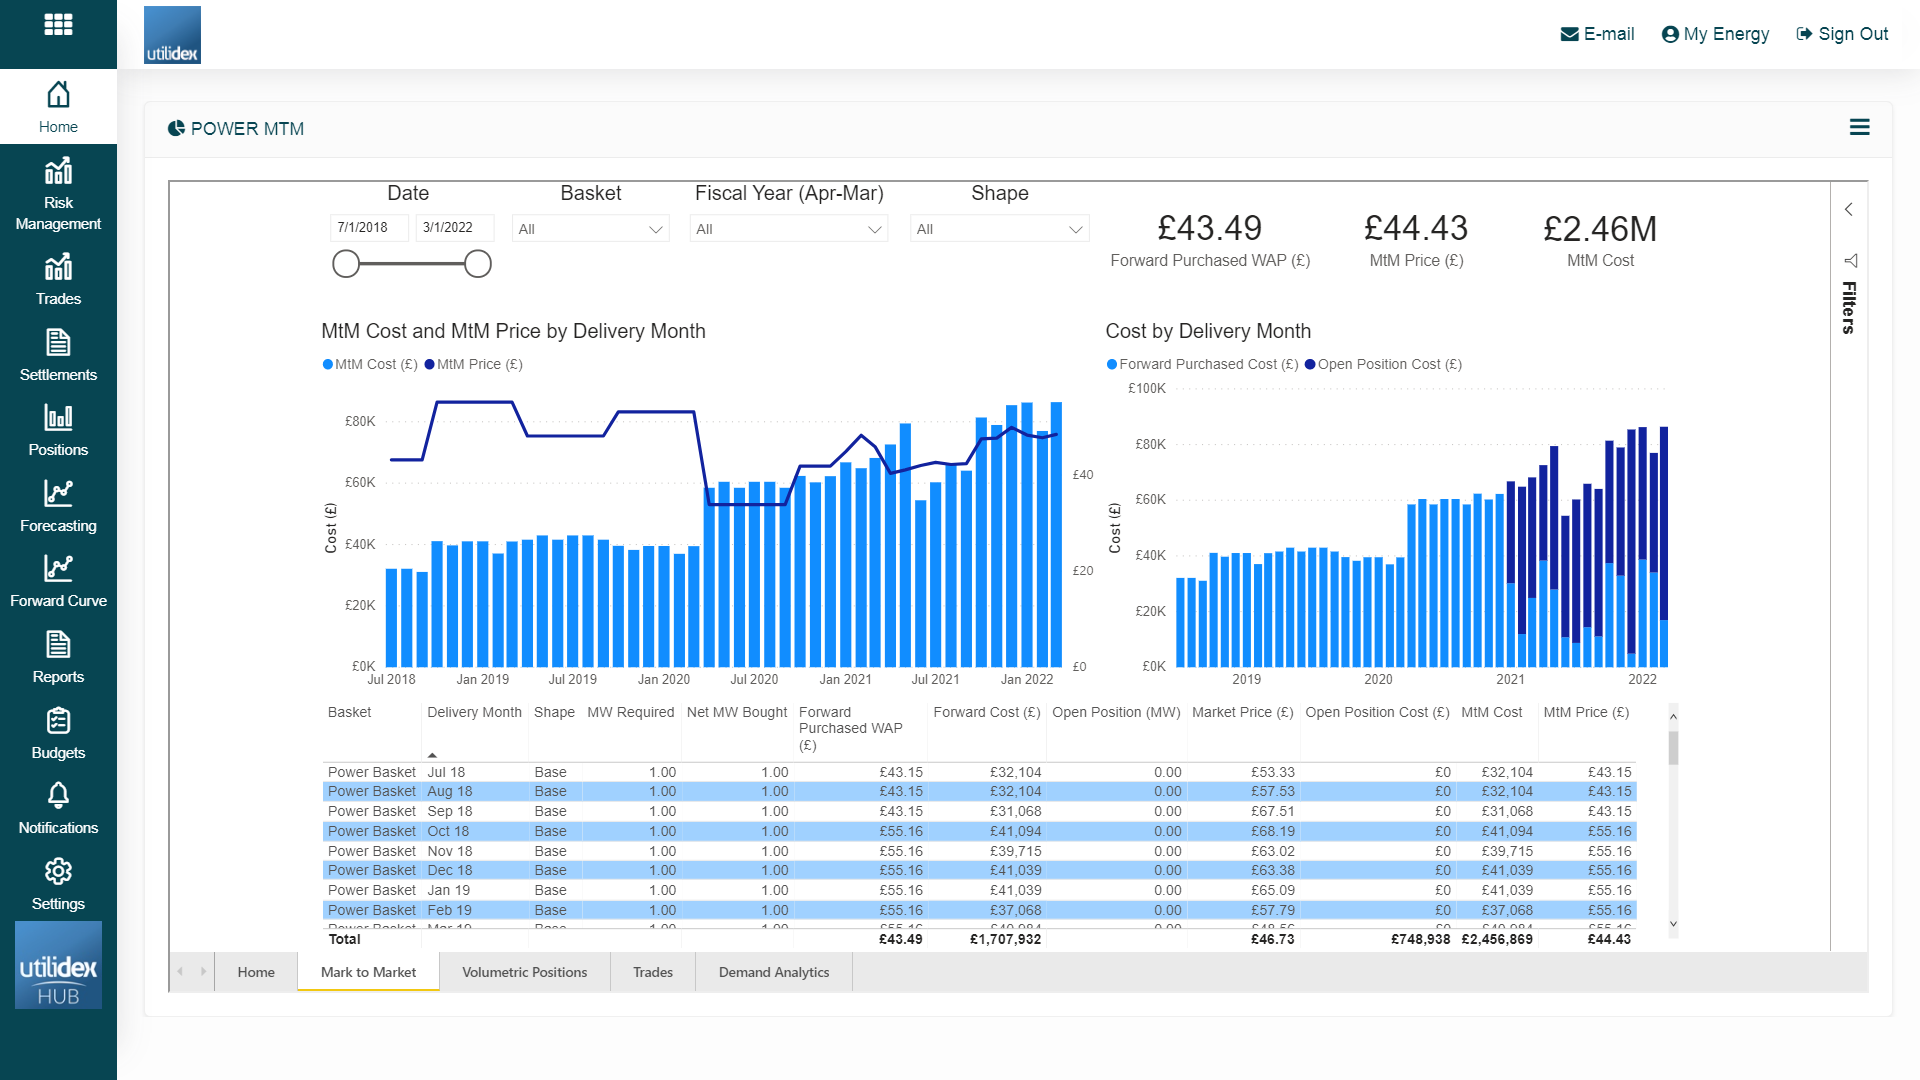
This report values the entire position as well as displays the Avg. Price Achieved and the Weighted Avg. Price of the commodity. The report can be customised to allow for analysis on individual baskets and custom date ranges. The report also contains data of the Volumetric Positions:
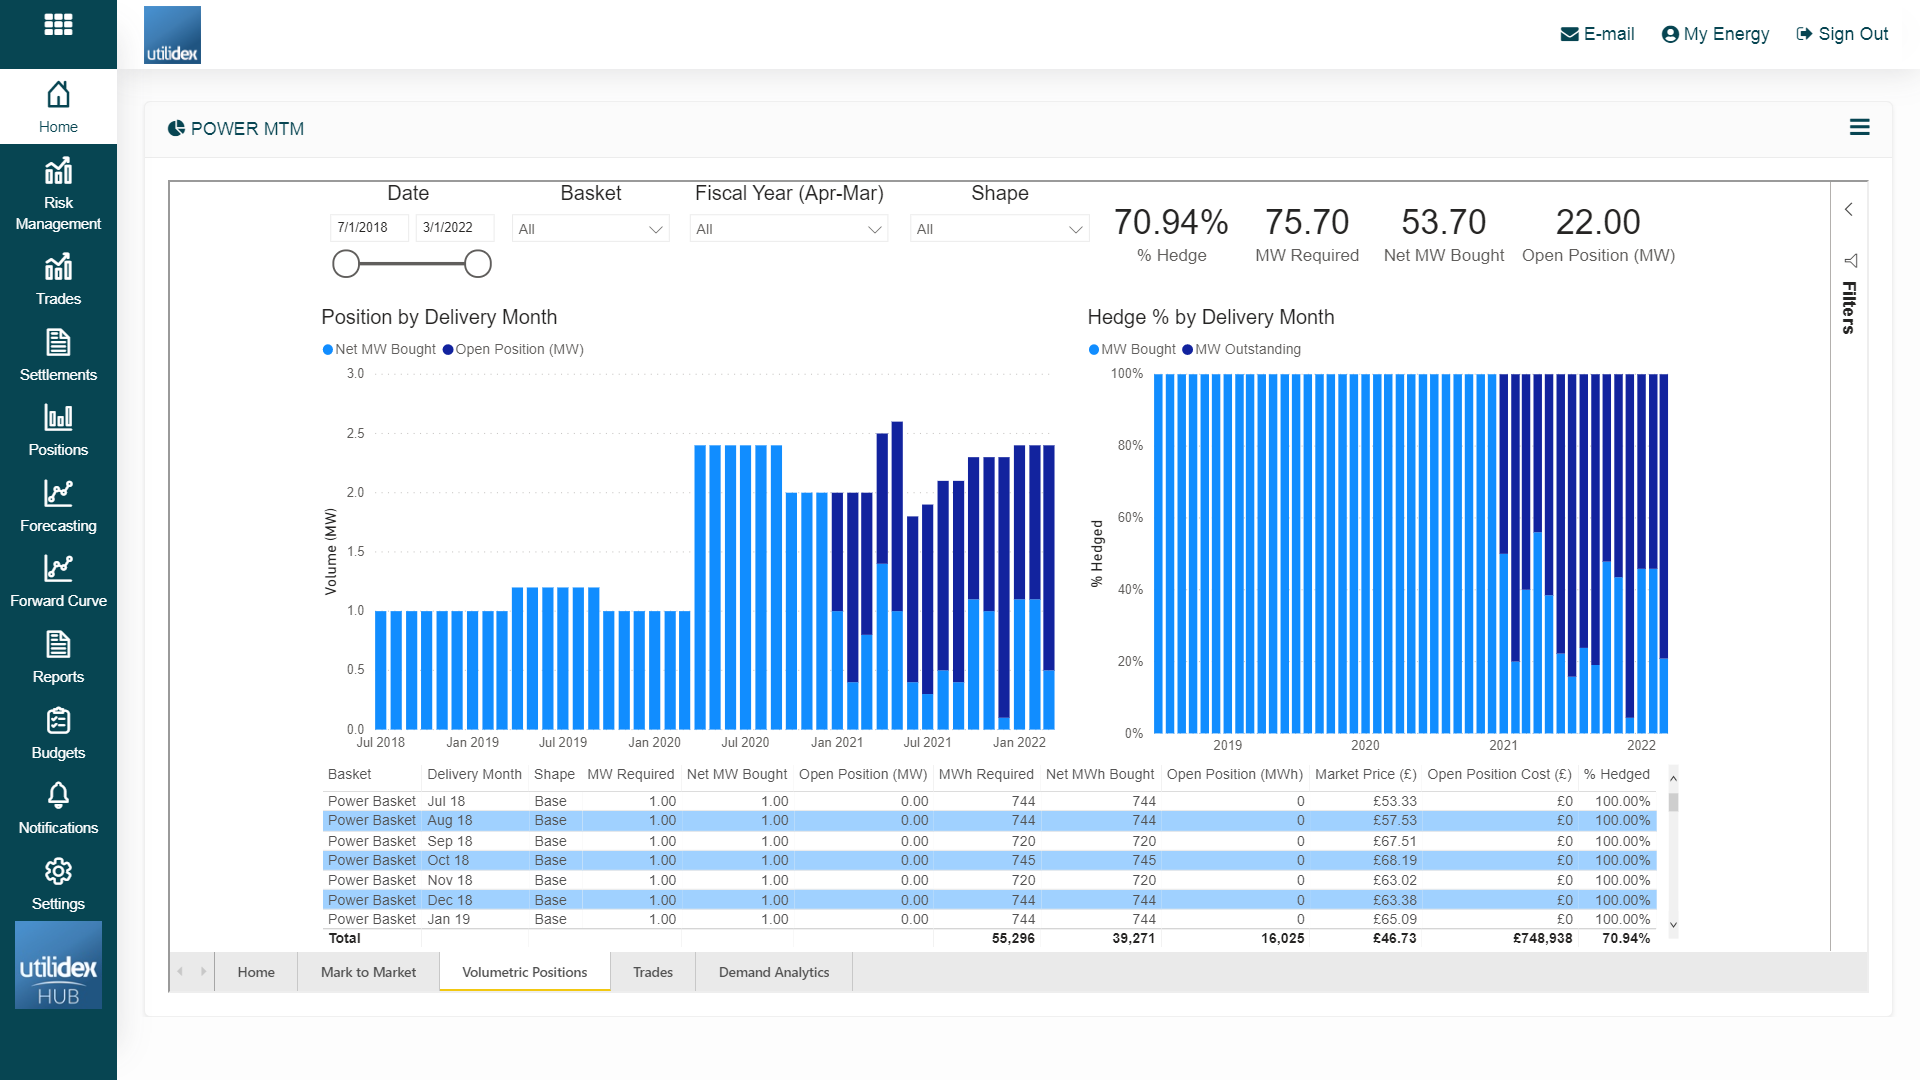
On this tab, the open volume for each volume is analysed. Users can view both the volumetric and percentage hedged for each basket over time. Users can view both base and peak together or individually for additional analysis.
The report displays the underlying data which runs the BI, users can also view their trades within the Trades tab.
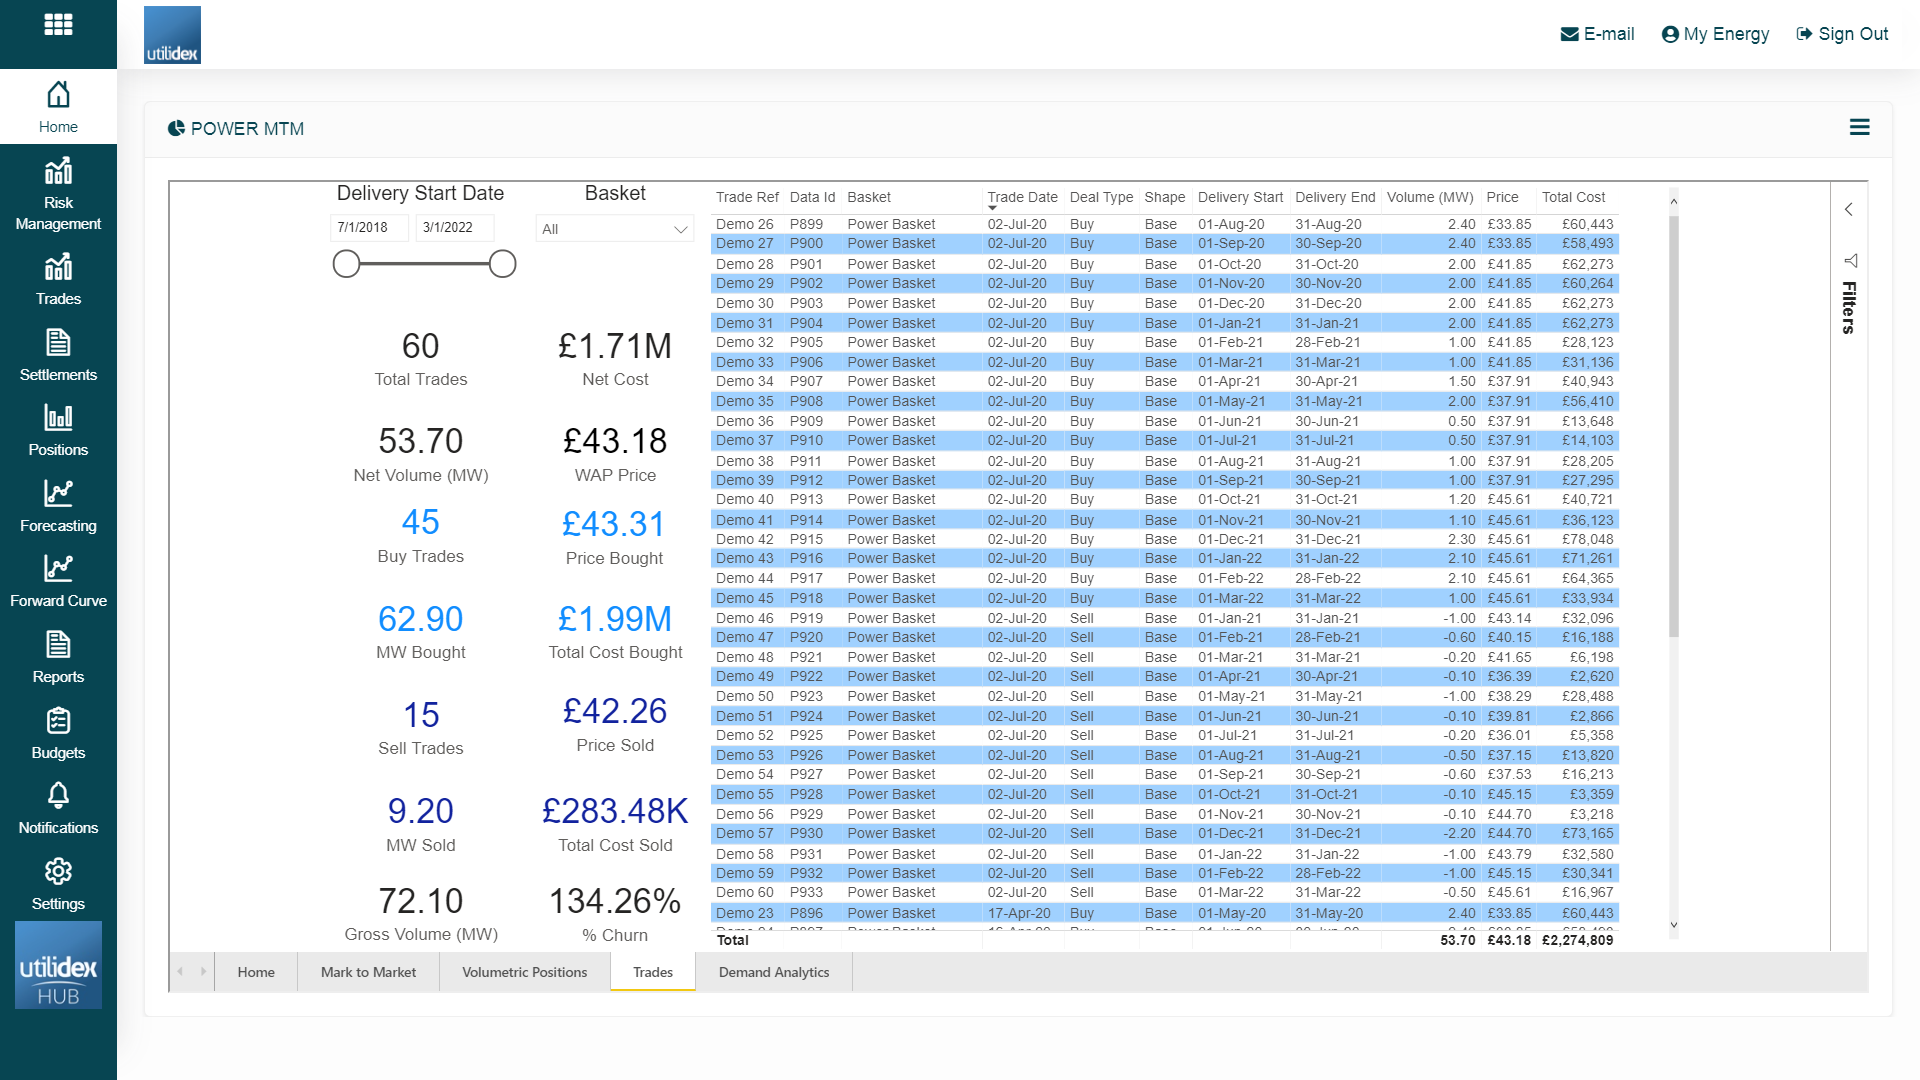
This allows for users to cross check the data in the reports.
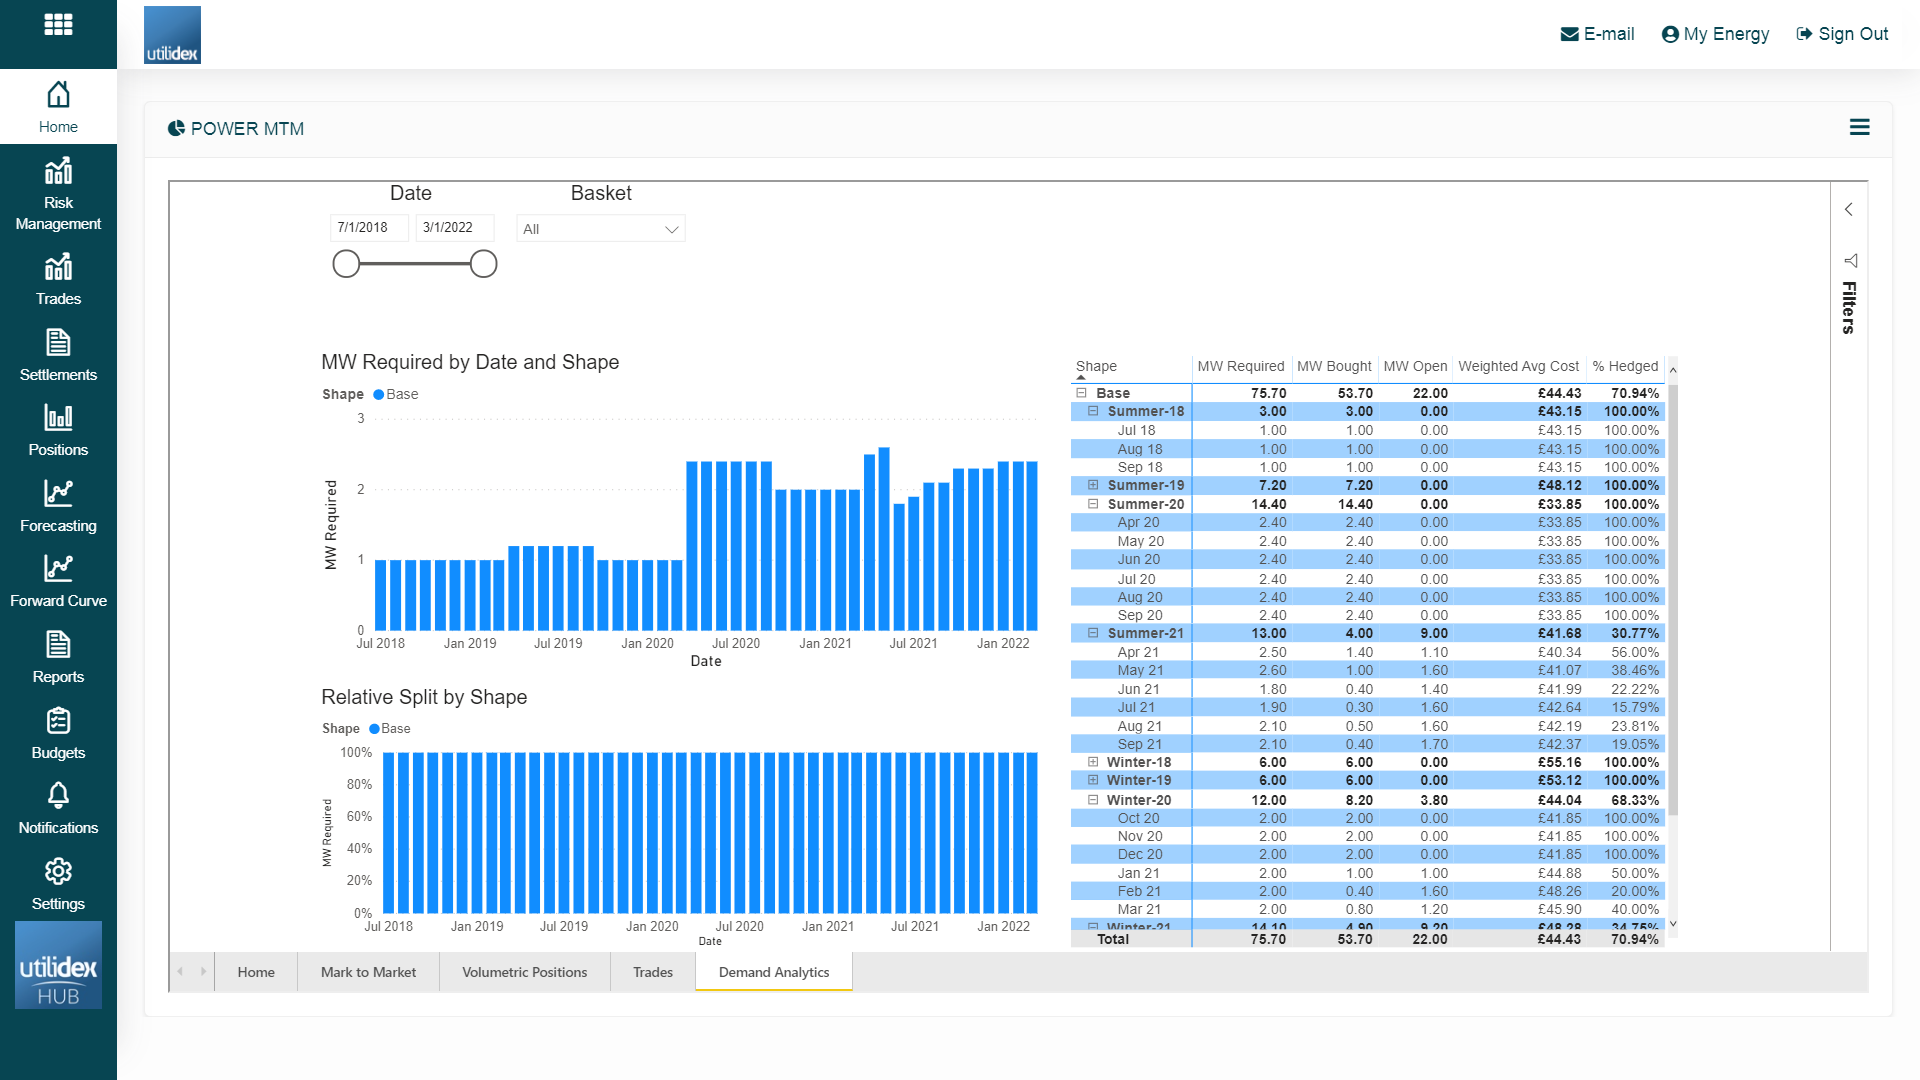
Finally, users can perform Demand Analytics on their purchase requirements to understand any seasonality or split between base and peak load baskets.
The demand analytics tab displays both the total volume and split between shapes for each basket. The report can be customised by date, and basket. The above screen shot contains demo data which only has Base demand.
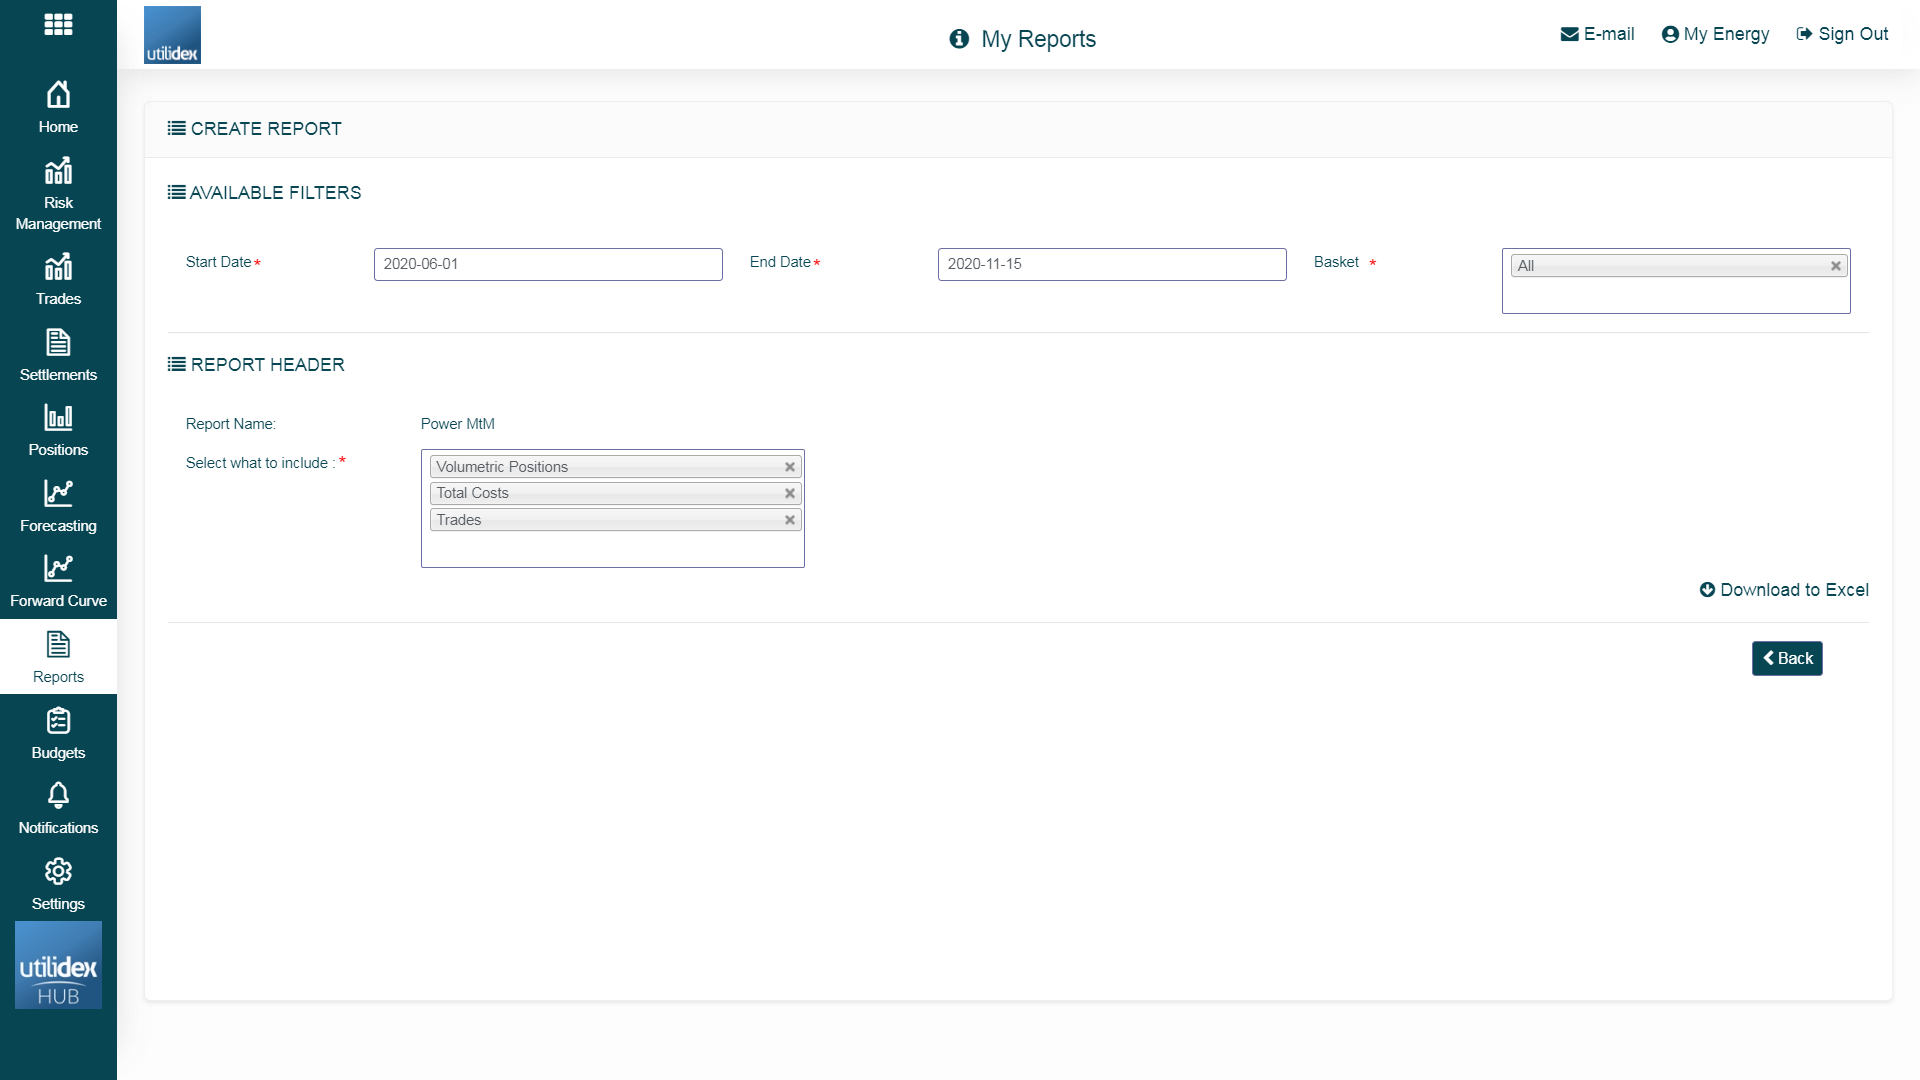
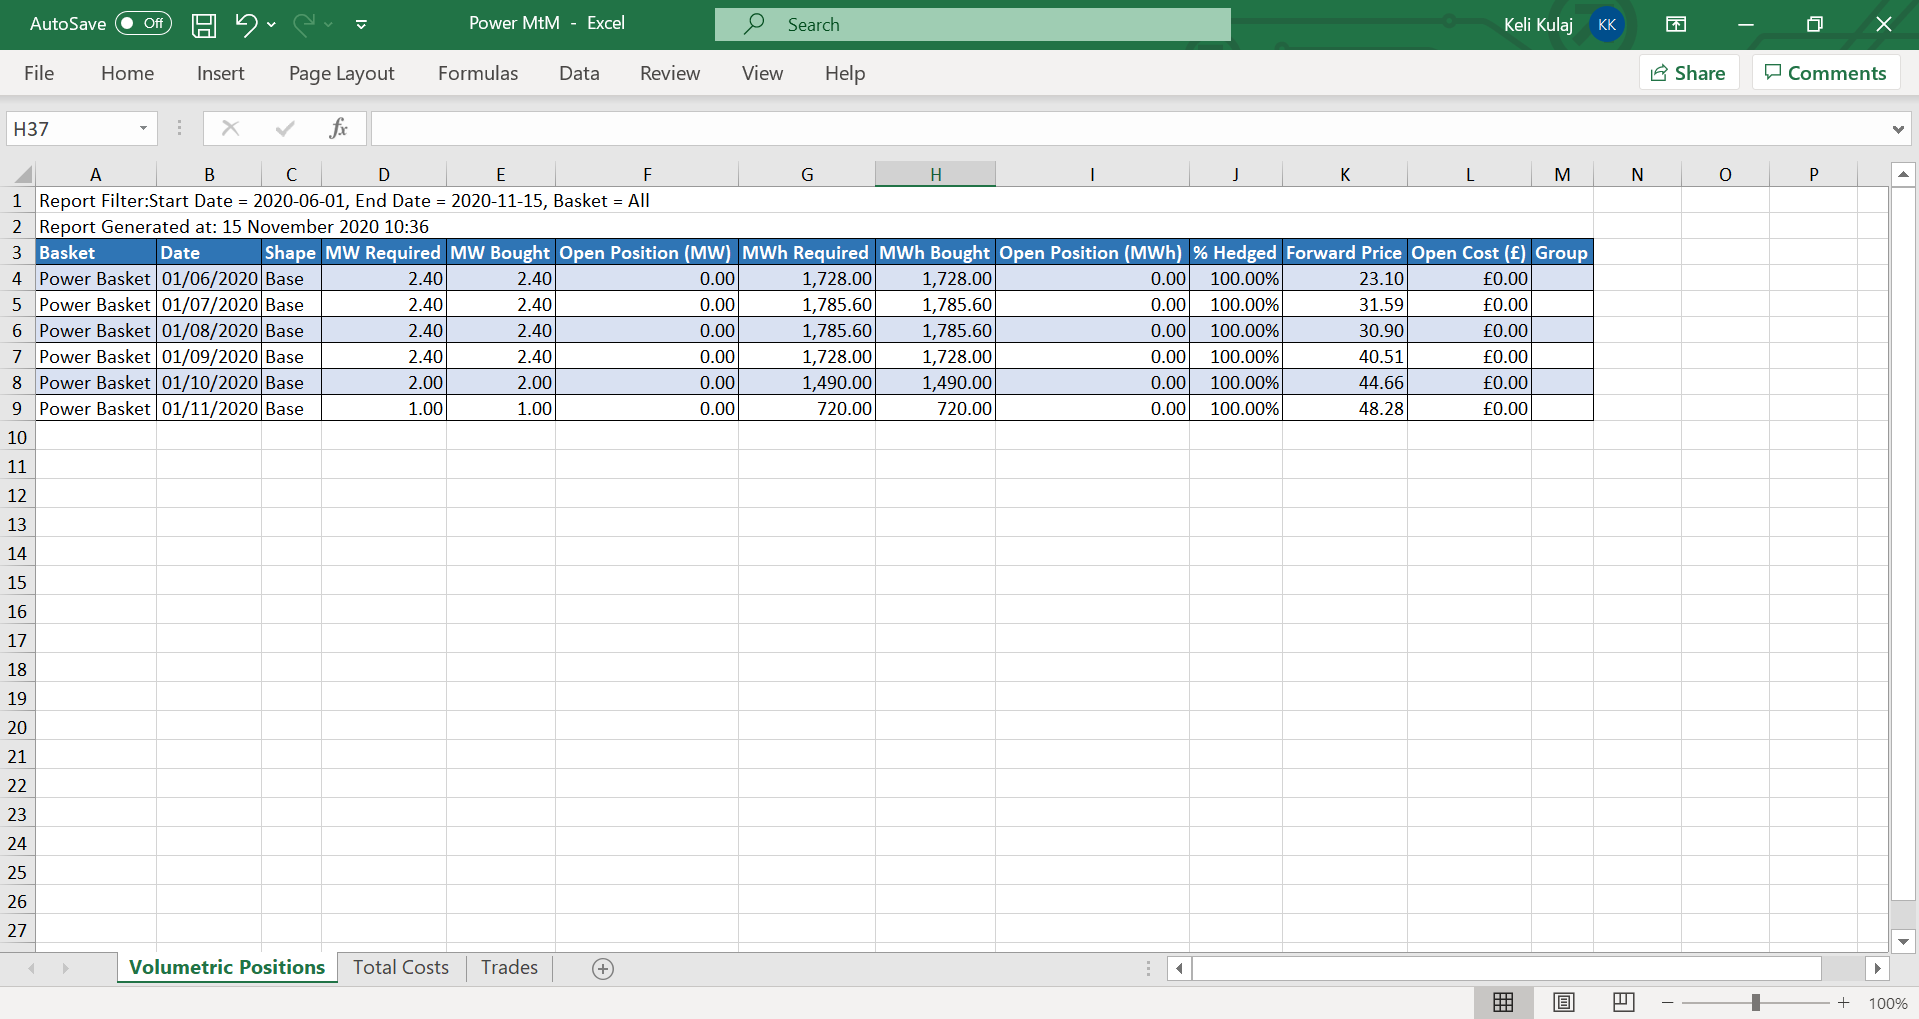
MtM Report
You can also download a Gas/Power MtM Report Navigating to Reports >> Generate Report >> Purchasing >> Gas/Power MtM. This shows Volumetric Positions, Total Costs and Trades. Below there is a representation of the Power one.