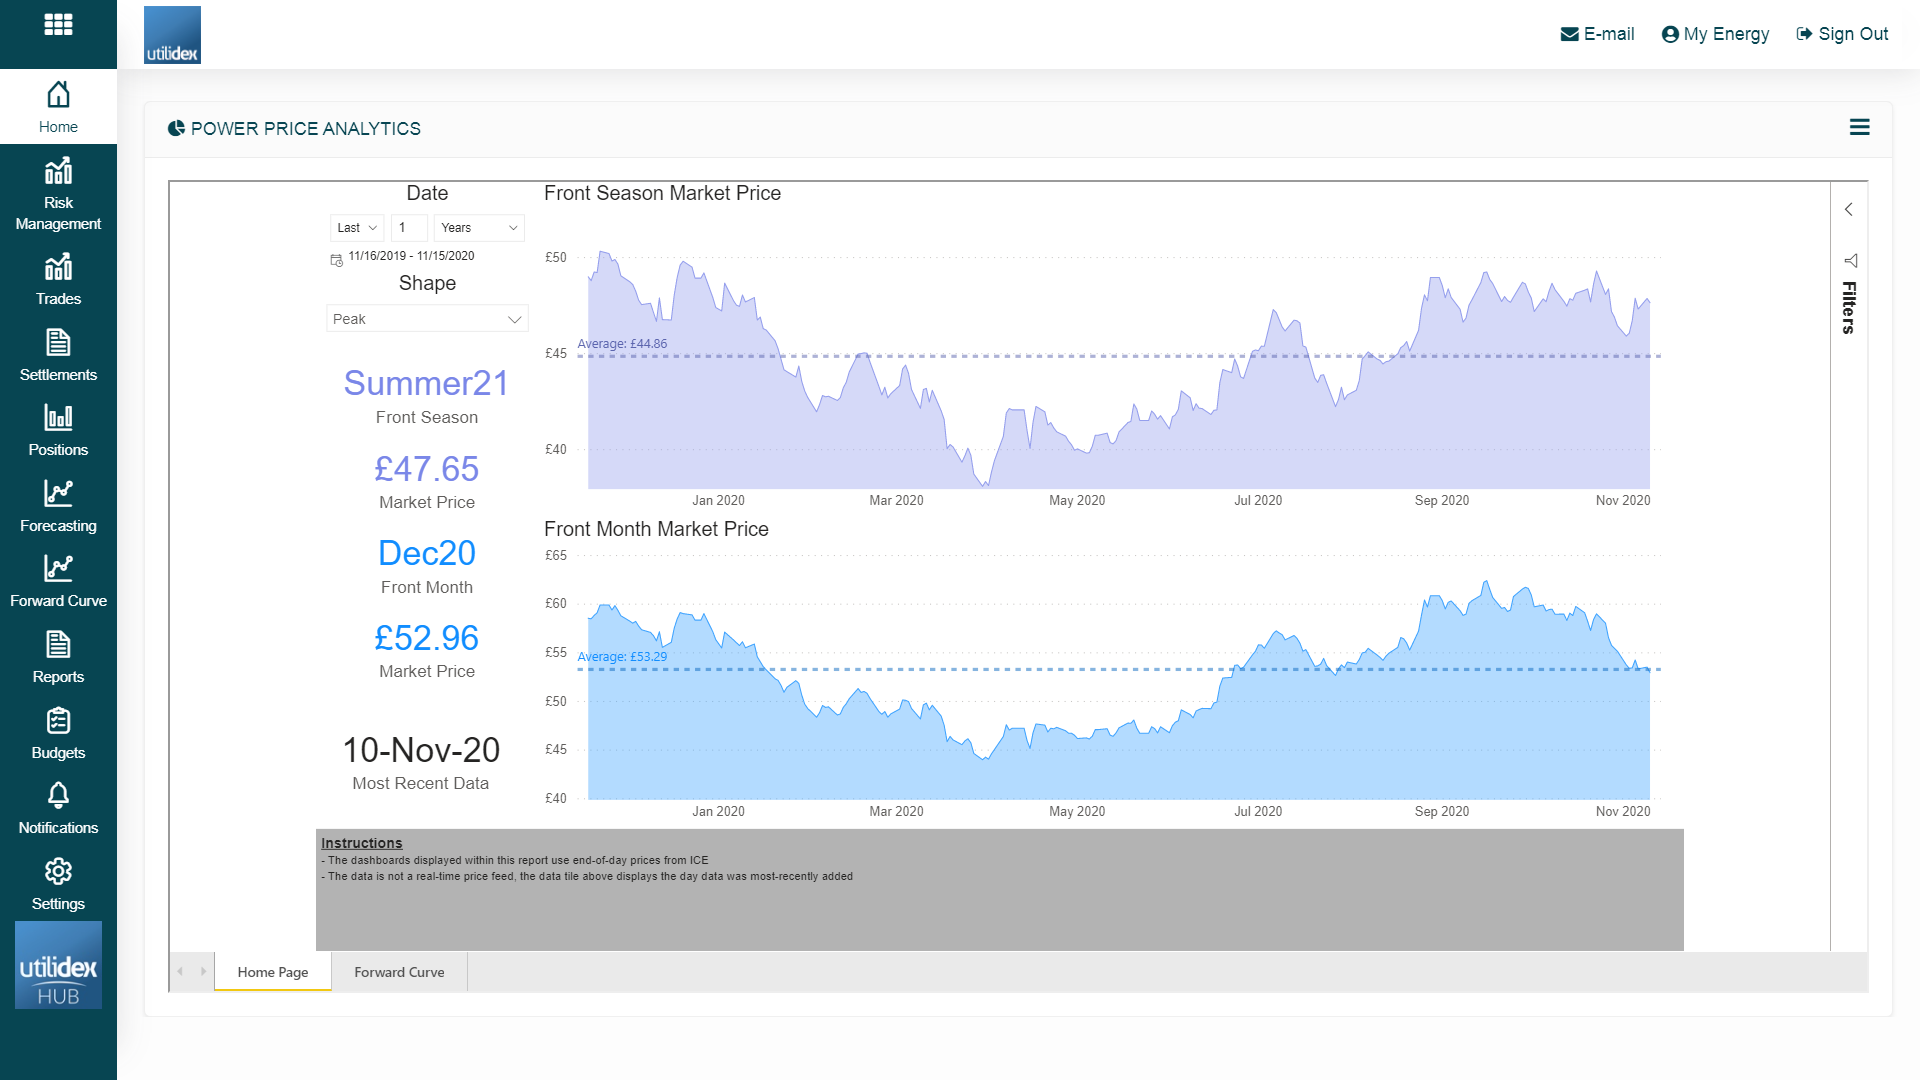
Users can also view Market Prices in Power BI. On the home tab, users can view the prices and price history for the forward season and month as well as see the most-recent date data was loaded. Users can change the date range to understand how the prices have moved within a more recent or extended time frame.
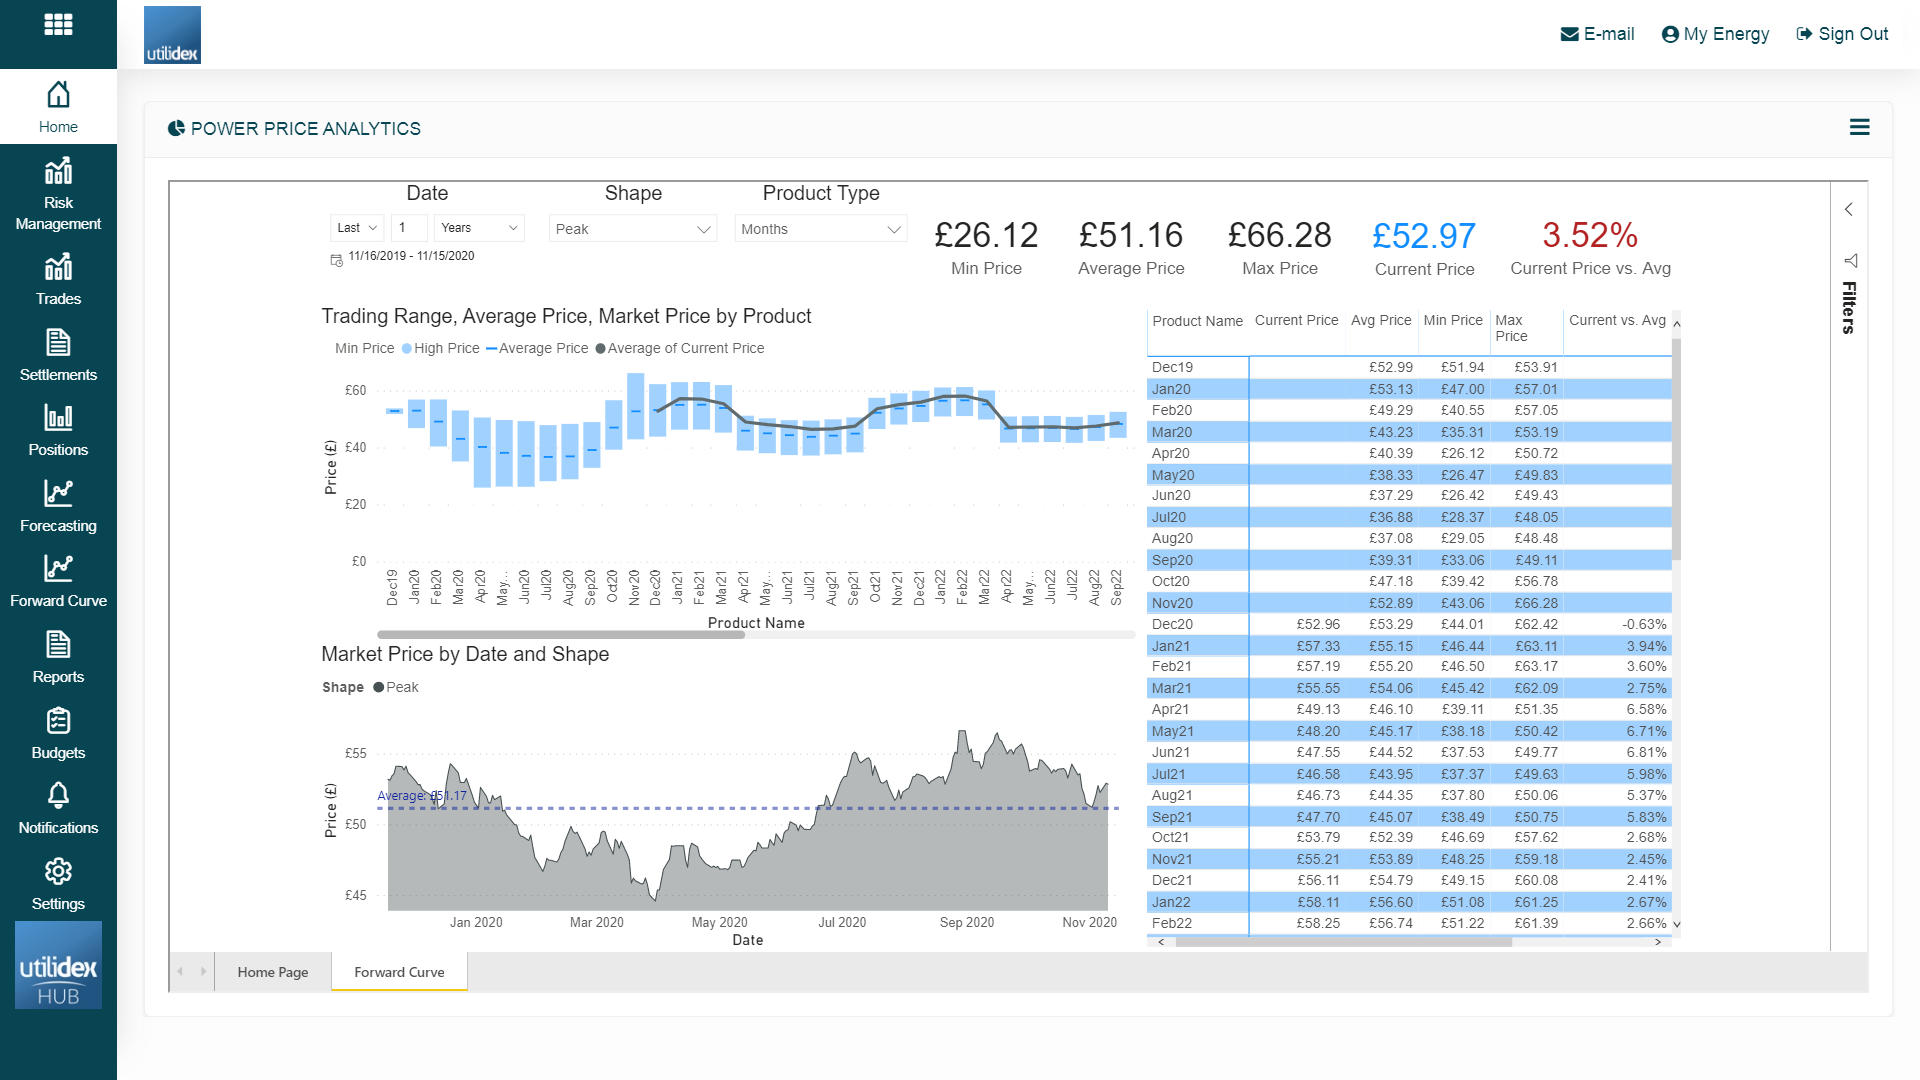
Users can also view a long-range view of the price curve in the Forward Curve tab. The date range can be adjusted as well as the type of forward curve displayed (i.e. months vs. quarters vs. seasons). The page also displays the minimum, average, and maximum price over the configured period. The dashboard shows the current market price in the pink line as well as in the light blue KPI, the market price is also analysed against the average over the same time period.
The below chart shows the forward curve, a user can view the price history of each contract by selecting the month in the chart above or within the table on the right.
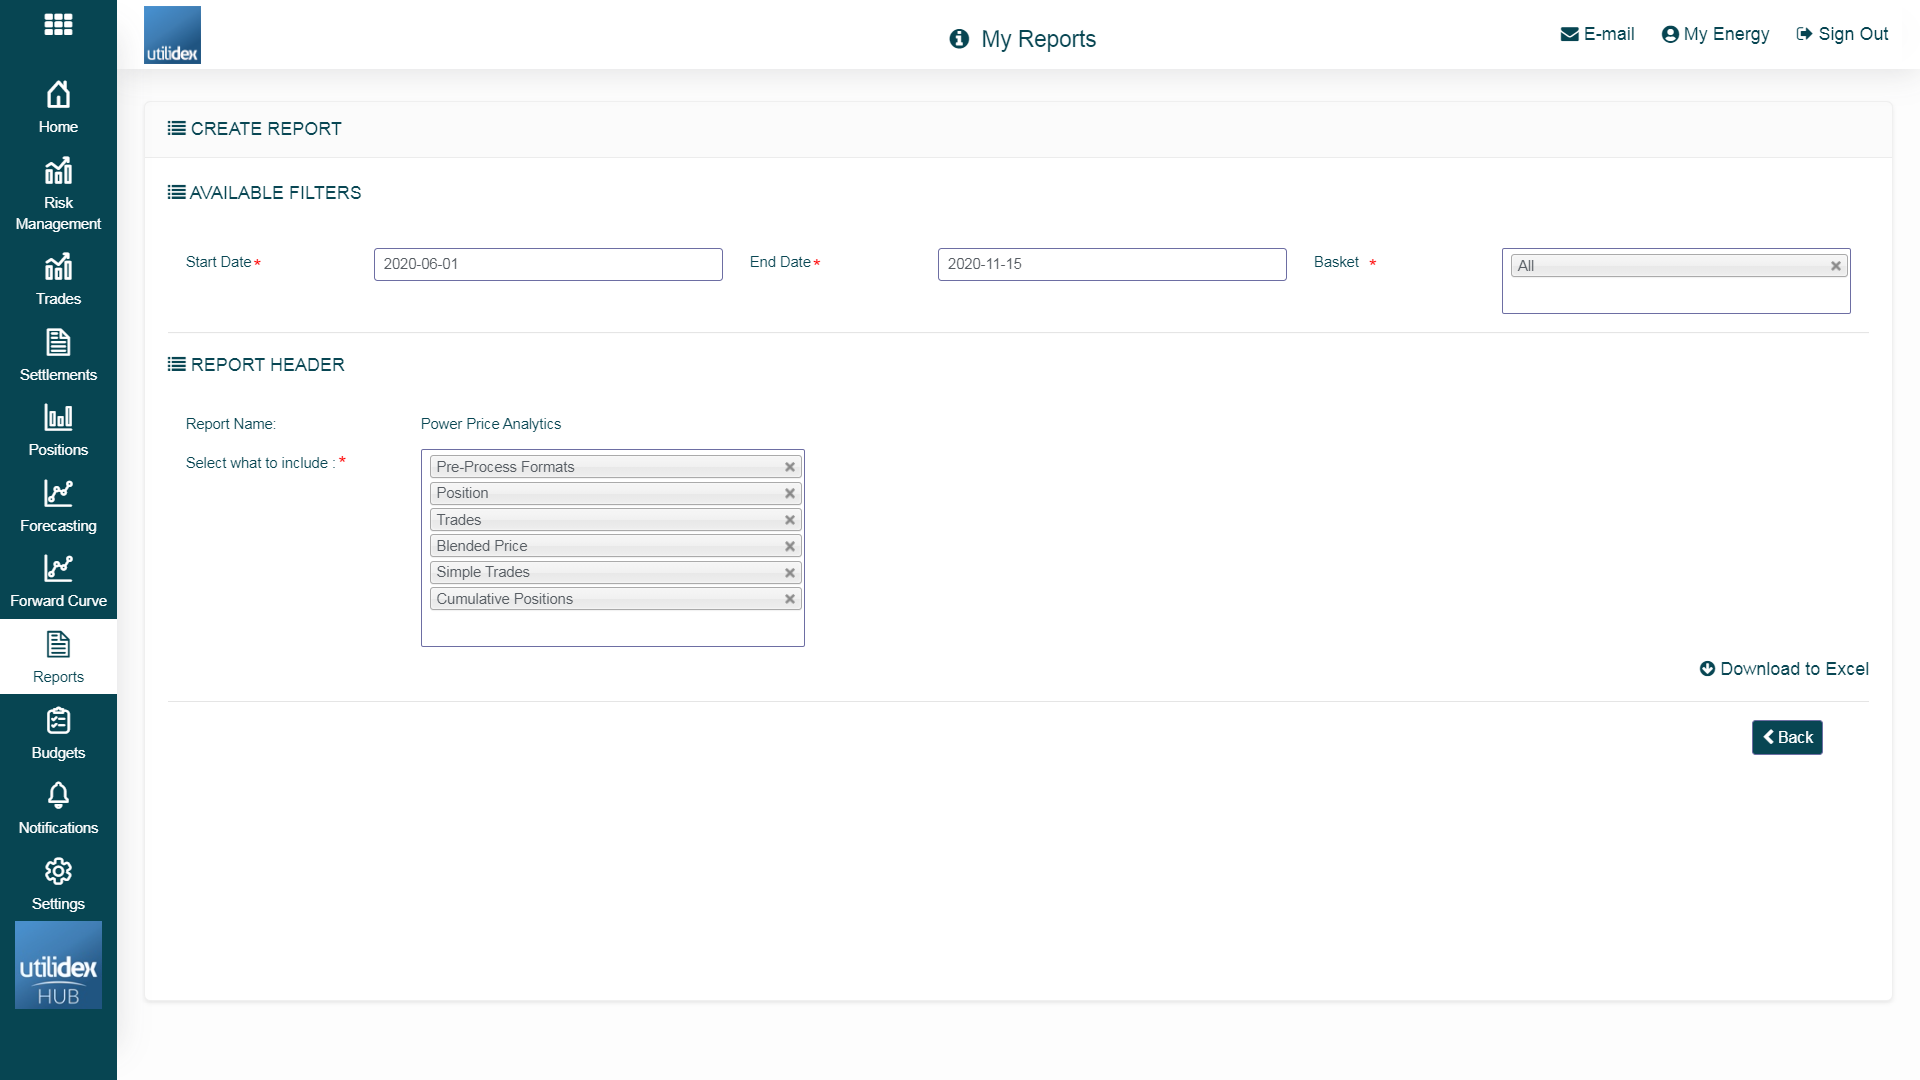
Price Analytics Report
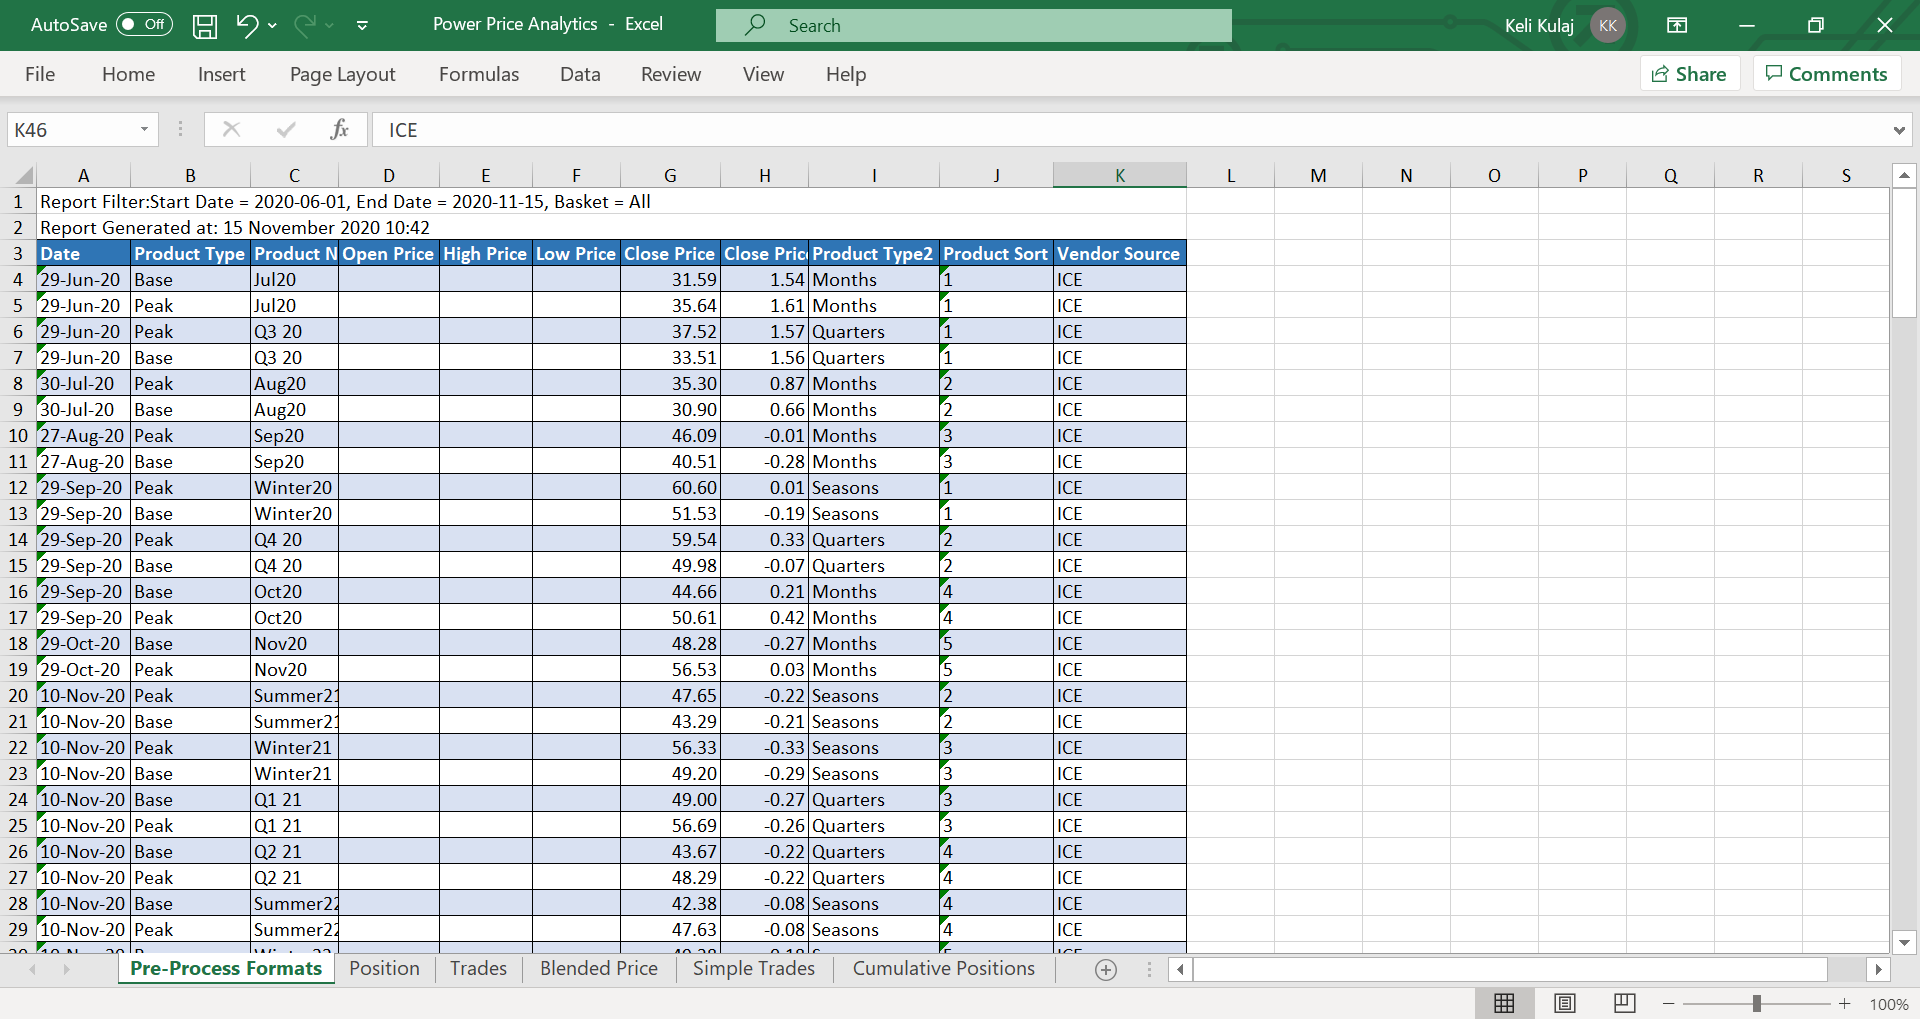
You can also download a Gas/Power Price Analytics Report Navigating to Reports >> Generate Report >> Purchasing >> Gas/Power Price Analytics. Below there is a representation of the Power one.