The Utilidex Hub can be set up to poll for new meter data every 15 minutes, checking either the email/FTP/SFTP depending on what has been set-up. The system will import all the data it finds on the location/landing area, whether that is the current day’s data or historical data that has been requested to back-fill any gaps.
The Hub uses your Site Standing data to determine what data it should be expecting in metering. You can access this page navigating Sites >> View Site List >> Select a site >> Services tab.
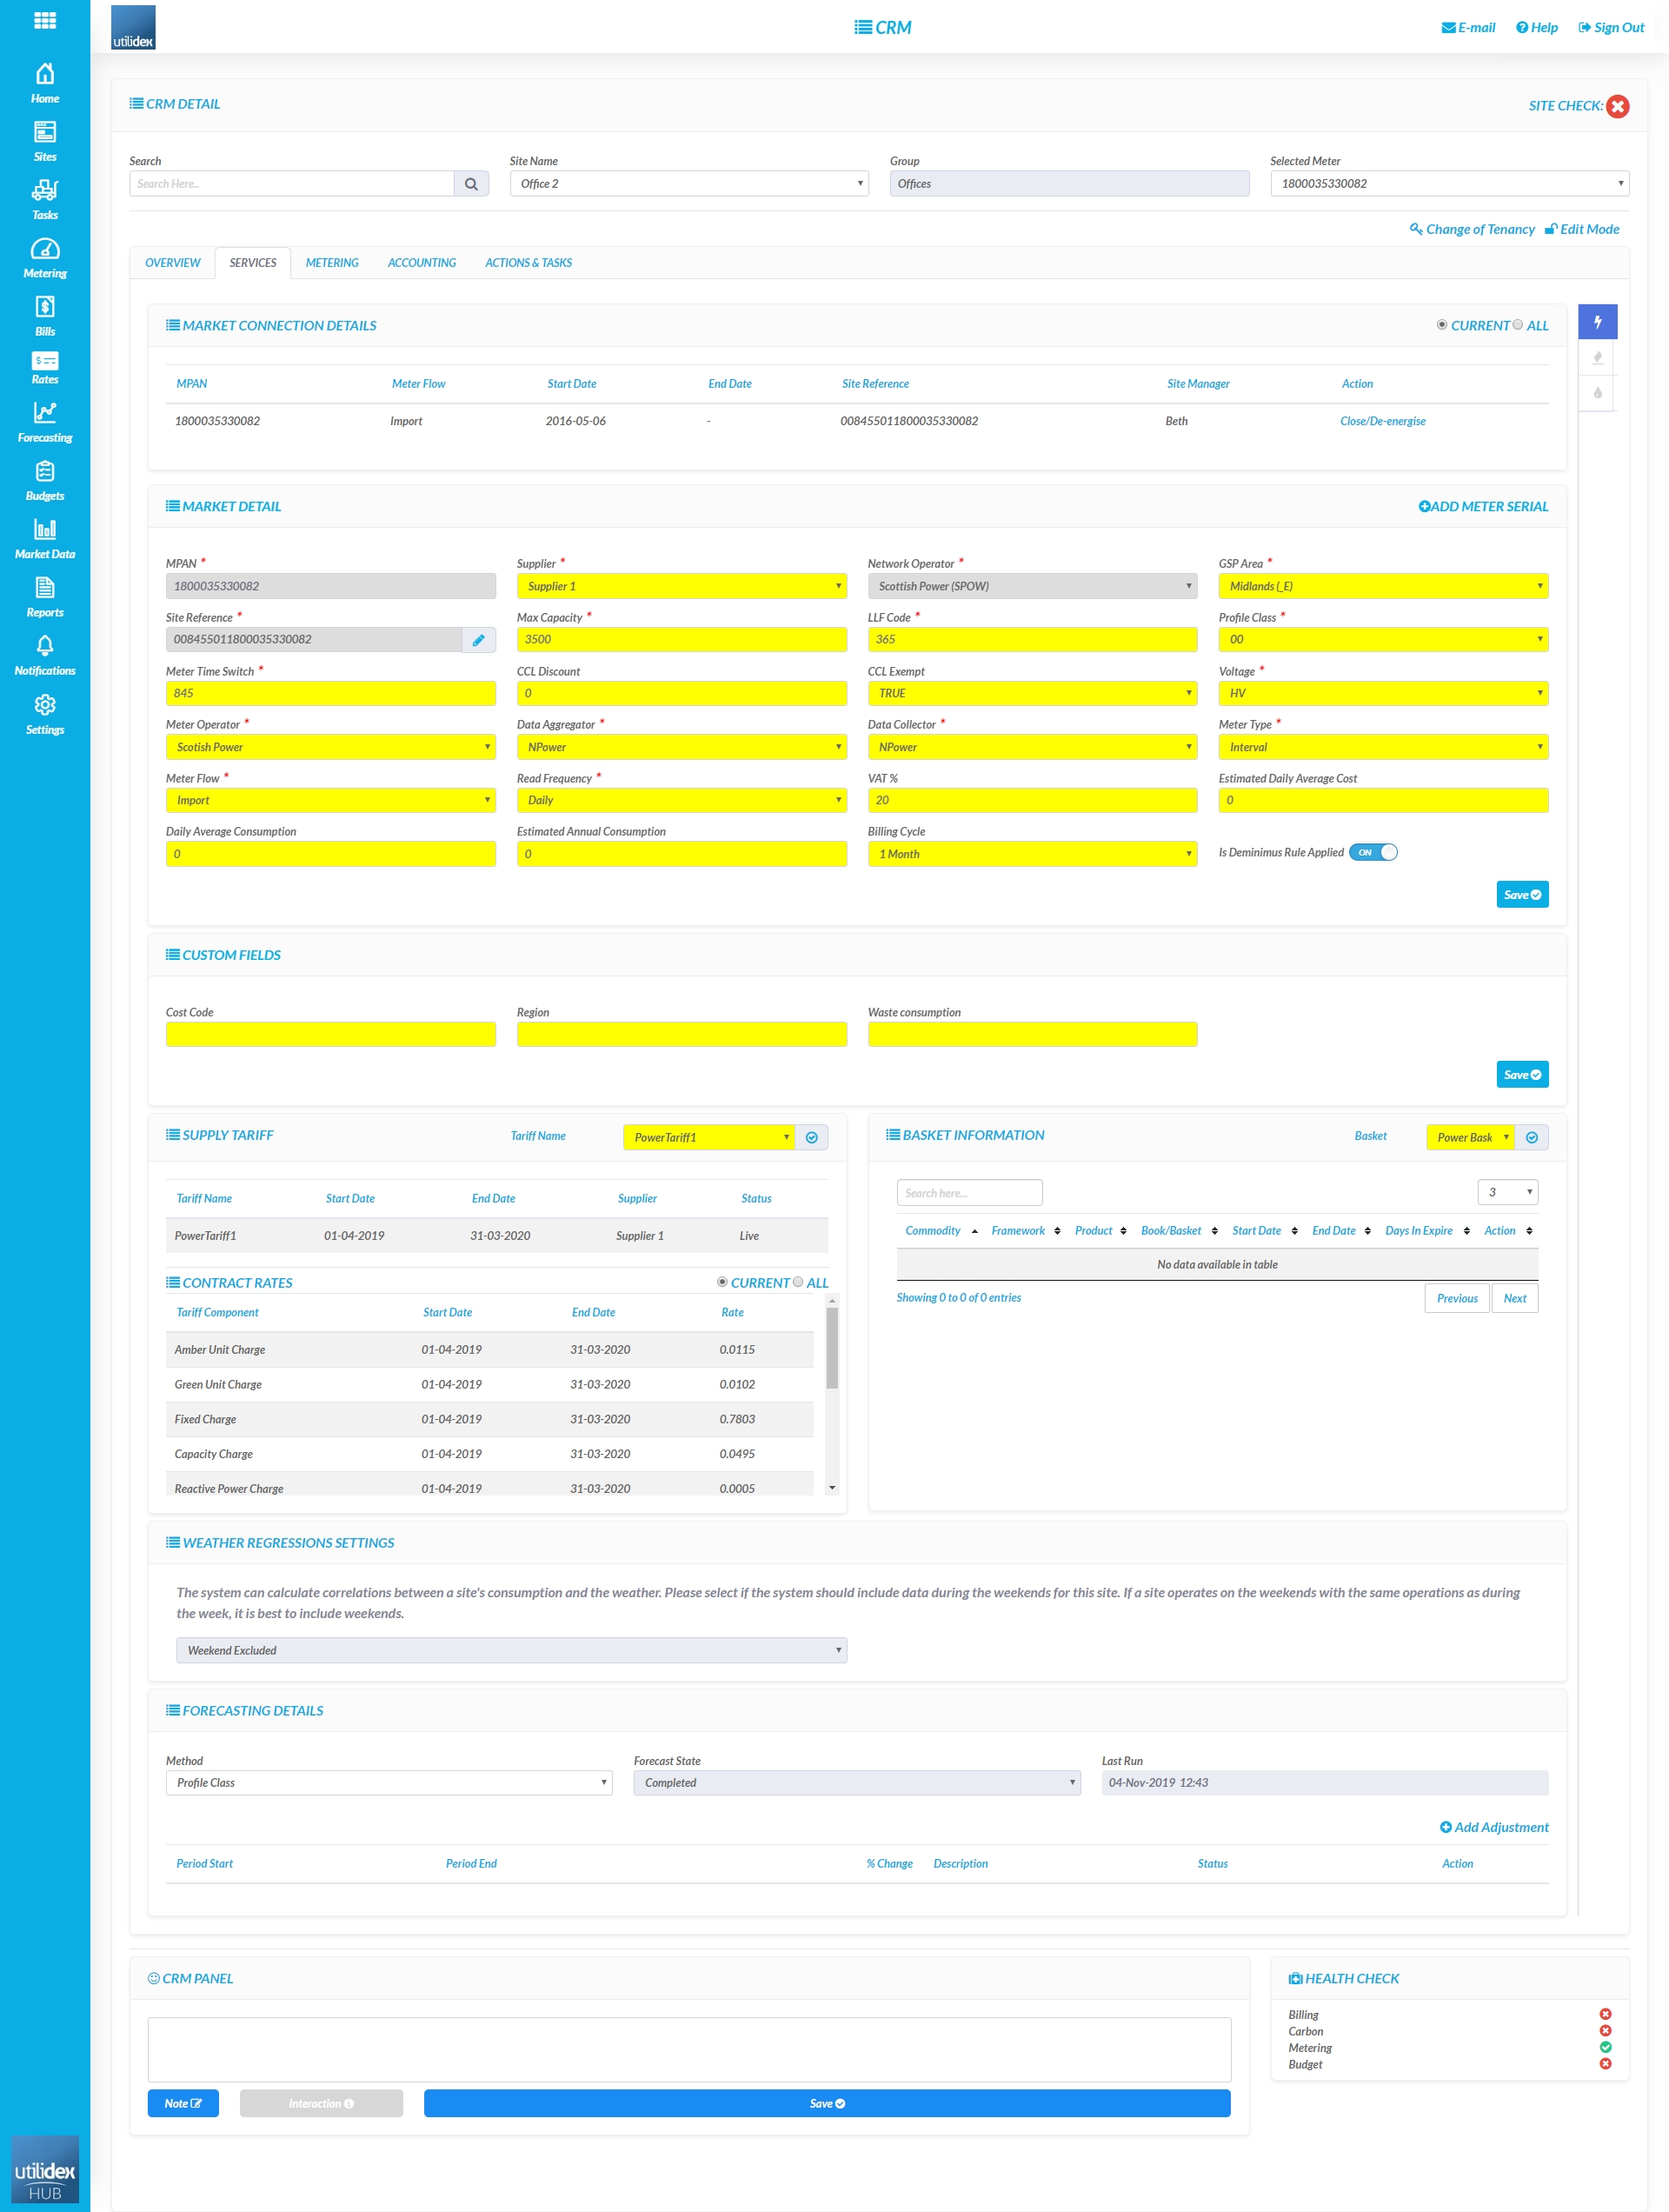
Each MPAN/MPRN has a setting which is Read Frequency. Furthermore, each MPAN has a Connection Start and End Date, which is effectively the start and end date that you as a customer/retailer are responsible for the site.
The Hub Platform uses these dates to determine “active connections” and then refers to the Read Cycle to see whether it is expecting a read or not for the MPAN.
Using this information, and then checking the read files received from your metering provider, the Hub can determine for you what meter data is missing and what you need to request from your provider.
Important: – Having accurate site information makes sure the Hub can accurately notify you of missing data and/or data that it is received for connections not set-up in your system. By periodically checking site data, updating and correcting site standing data, you will save numerous hours in all of your downstream activities.
If you have multiple feeds for a single meter (for example, if you are receiving settled data as well as raw data for a meter), please be aware that all downstream activities rely on the feed registered in the Hub as the Data Aggregator (DA).
Metering Imports Management
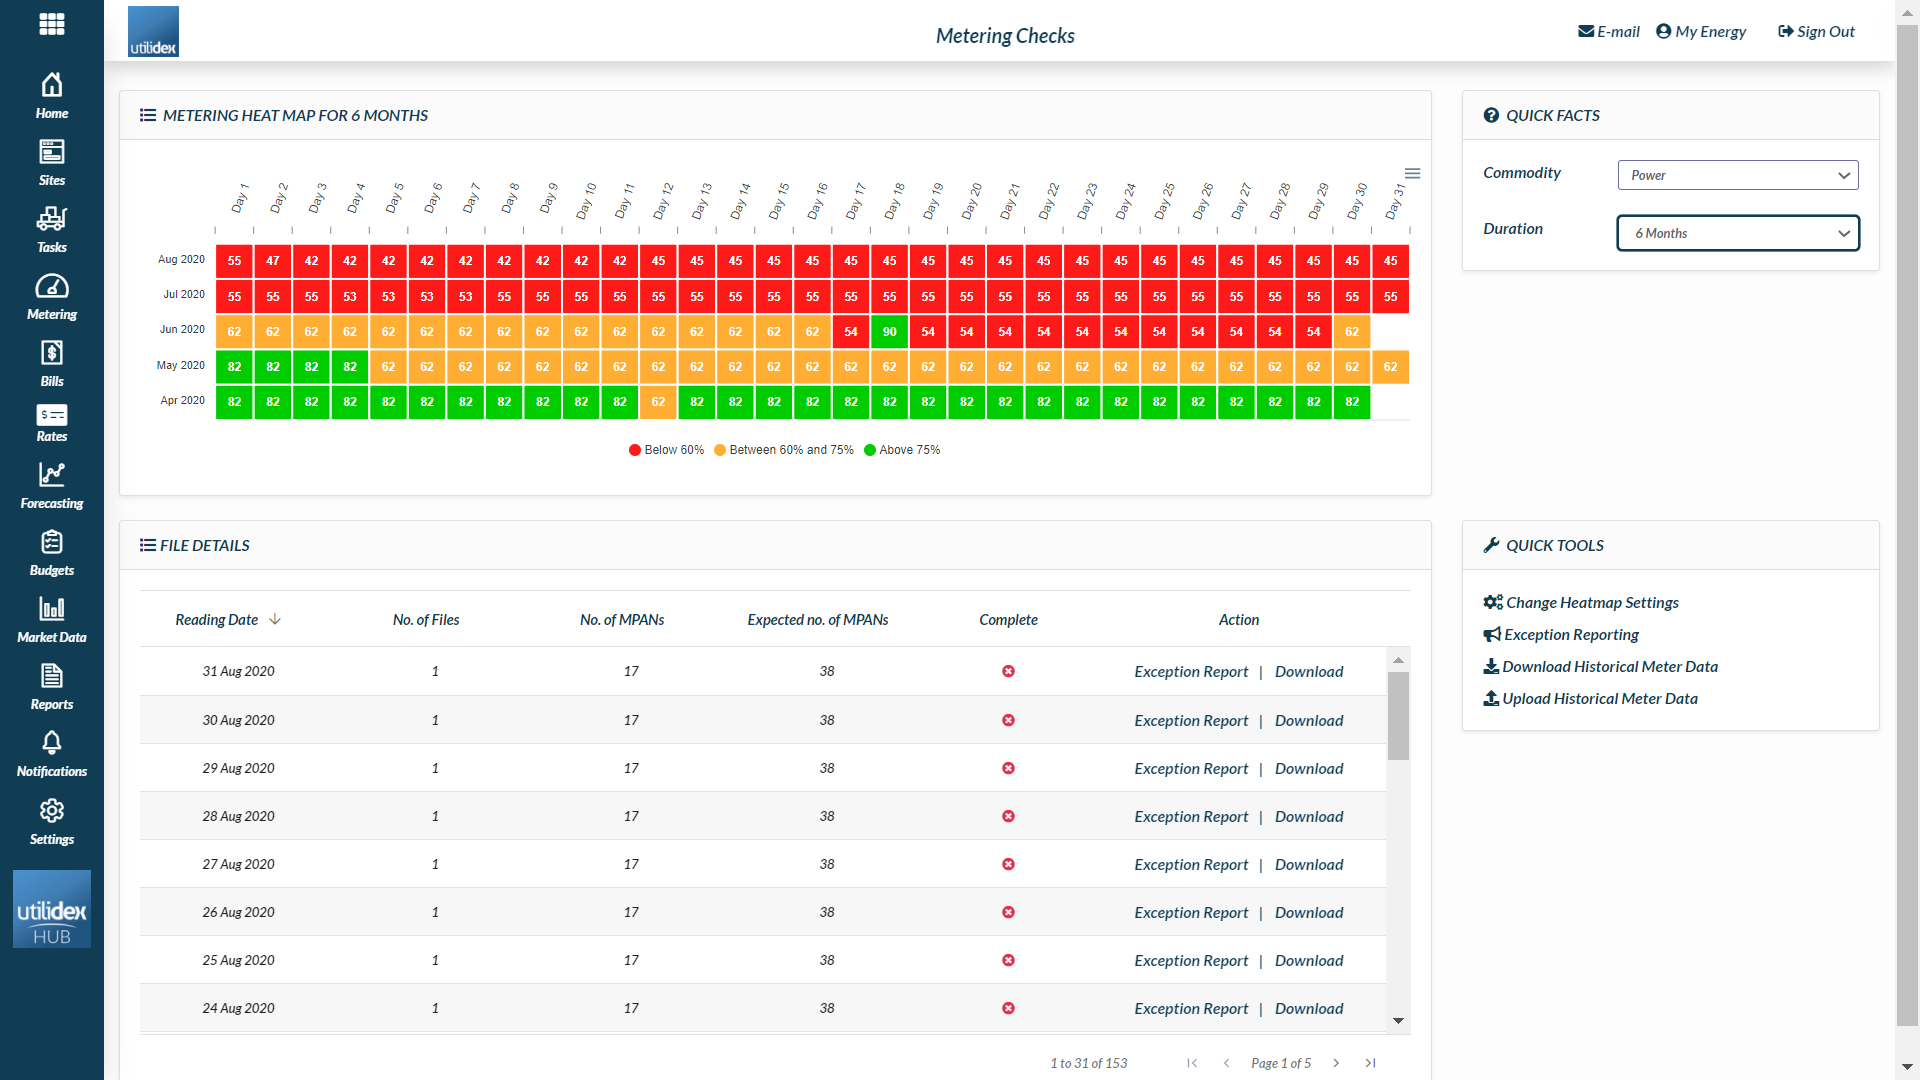
The Metering imports heatmap screen can be found by navigating to Metering >> View Heatmap. The heatmap colours represent the following:
- Green: full set of data, no exceptions
- Amber: full set of data, with exceptions
- Red: missing data
The metering heat map can be configured for half hourly electricity and AMR meters in general for gas, power and water. You can toggle the filters on the top of the screen, to select commodity, and range to view the data.
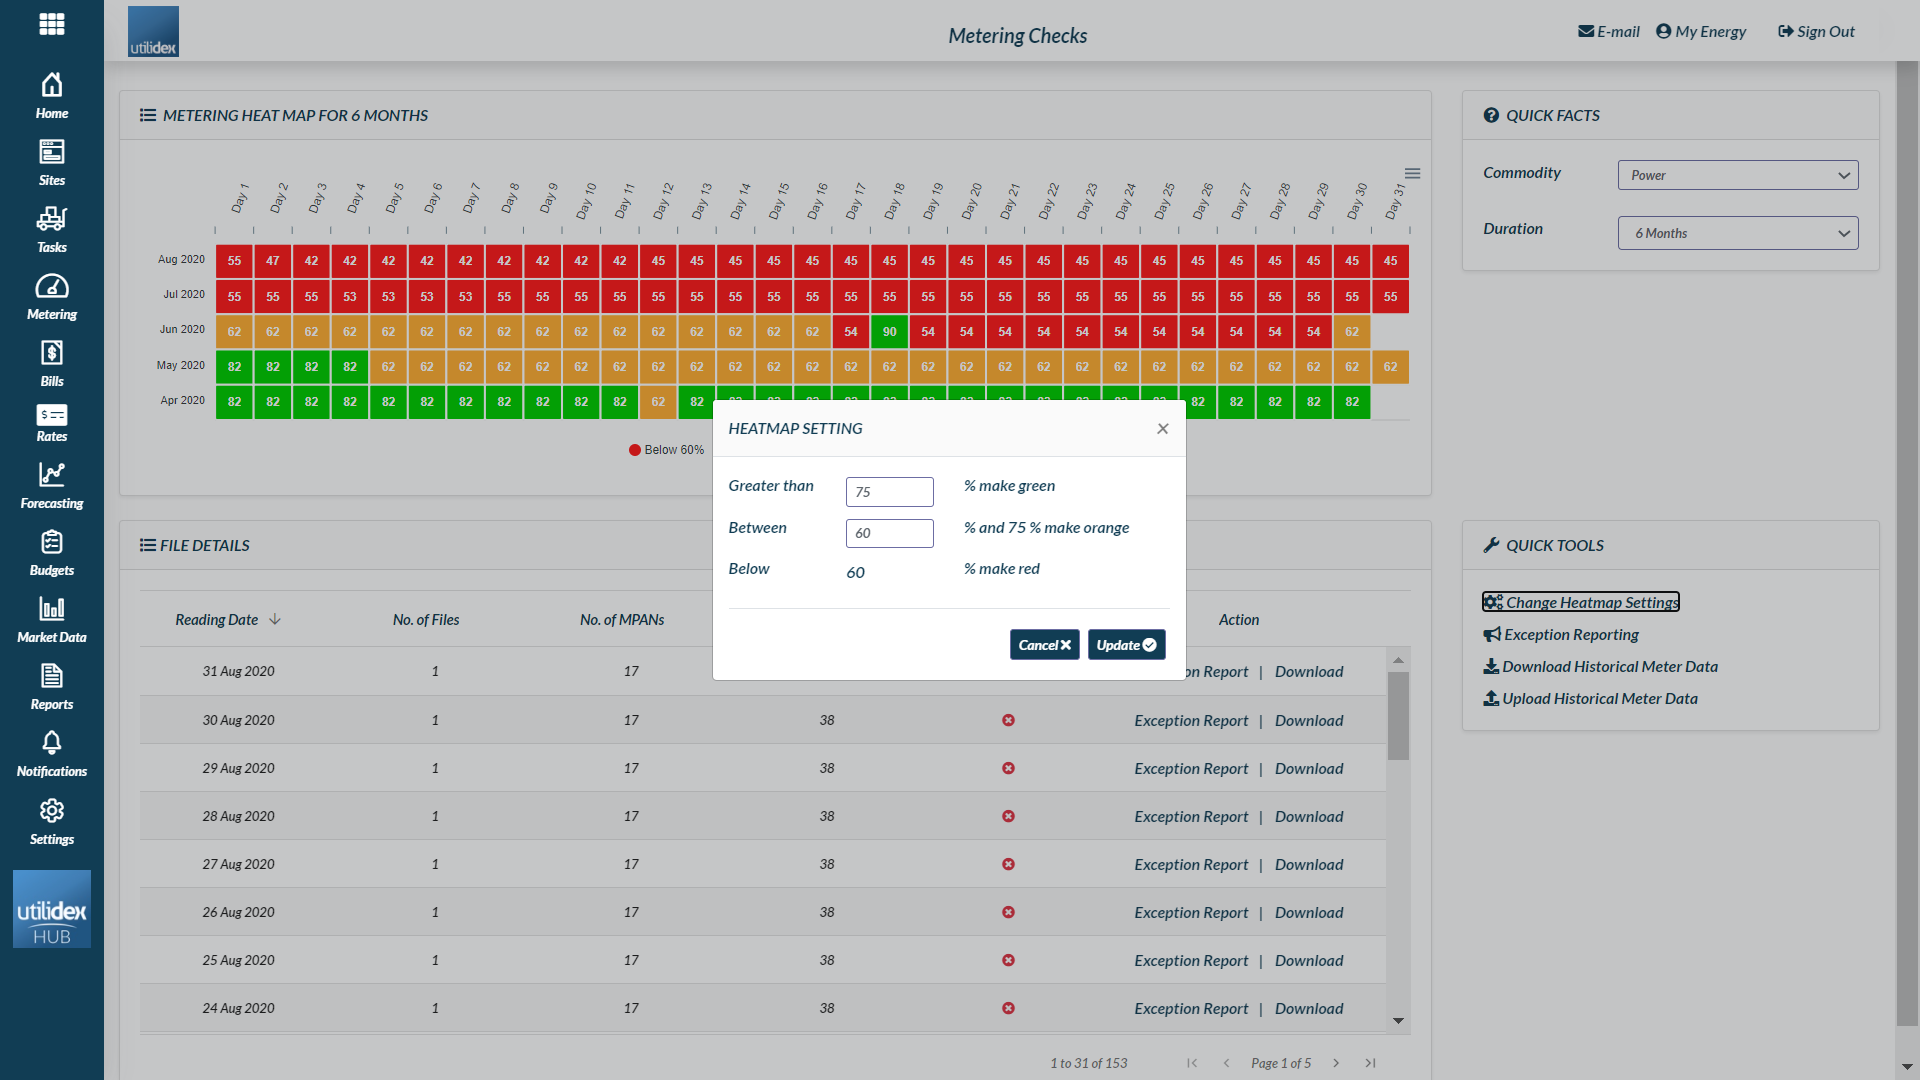
You can easily configure your heat map settings, by clicking on “Change heat map settings”, and then adjusting the thresholds as necessary.
Exception reporting
There are several additional useful features on the metering page which will help you manage your metering data. One of the most important aspects is the “Exception Reporting” which can either be run daily or run over a specific period. You can either run the exception report on a daily basis (which is recommended for very large estates) or alternatively run it weekly/monthly by clicking on the Exception Reporting.
The Exception report produces five tabs as detailed below:
- Missing Data (Active): This shows the missing data, the period from and to as well as the metering provider. We’d recommend you contact your Meter Provider and then request the metering data from them.
- Missing Data (Reactive): This tab shows the missing data, the period from and to as well as the metering provider. We’d recommend you contact your Meter Provider and then request the metering data from them.
- Site not set-up: This tab shows you any metering data that you are receiving which is not set-up in the Hub. It’s common if the data is being sent to you, that you are being charged for it. So definitely check if you do not think the sites should be yours.
- Incorrect Meter Configuration: This is where the Hub is listing the site as a NHH meter and it is being received as a HH meter. It could be that the site has had a meter change, or it could be that the site was set-up incorrectly. But worth checking with your metering agent, and then correcting the data in the Hub as necessary. This will then not show up in future reports.
- Incorrect Data Provider: This is where the Hub is listing the site as being sent by one provider, but data is being received from another. This may again need checking. It could be as simple as updating the Hub, or if you think you should not be receiving data – perhaps best to contact your metering agent.
IMPORTANT: we highly recommend you run an exception report at least weekly on your data, and daily in large estates. By checking this data and working with your metering agent, you’ll be able to resolve any meter data issues, before they become real problems. By checking and quickly correcting data, you save significant time in downstream activities. Whilst it may seem like a big investment of time in checking data, what you’ll find is that you’ll save time later on. We estimate for every 1hr you spend on checking/correcting data you’ll save 5hrs in downstream activities. So it’s better to be proactive when it comes to meter data management.
Downloading your meter data
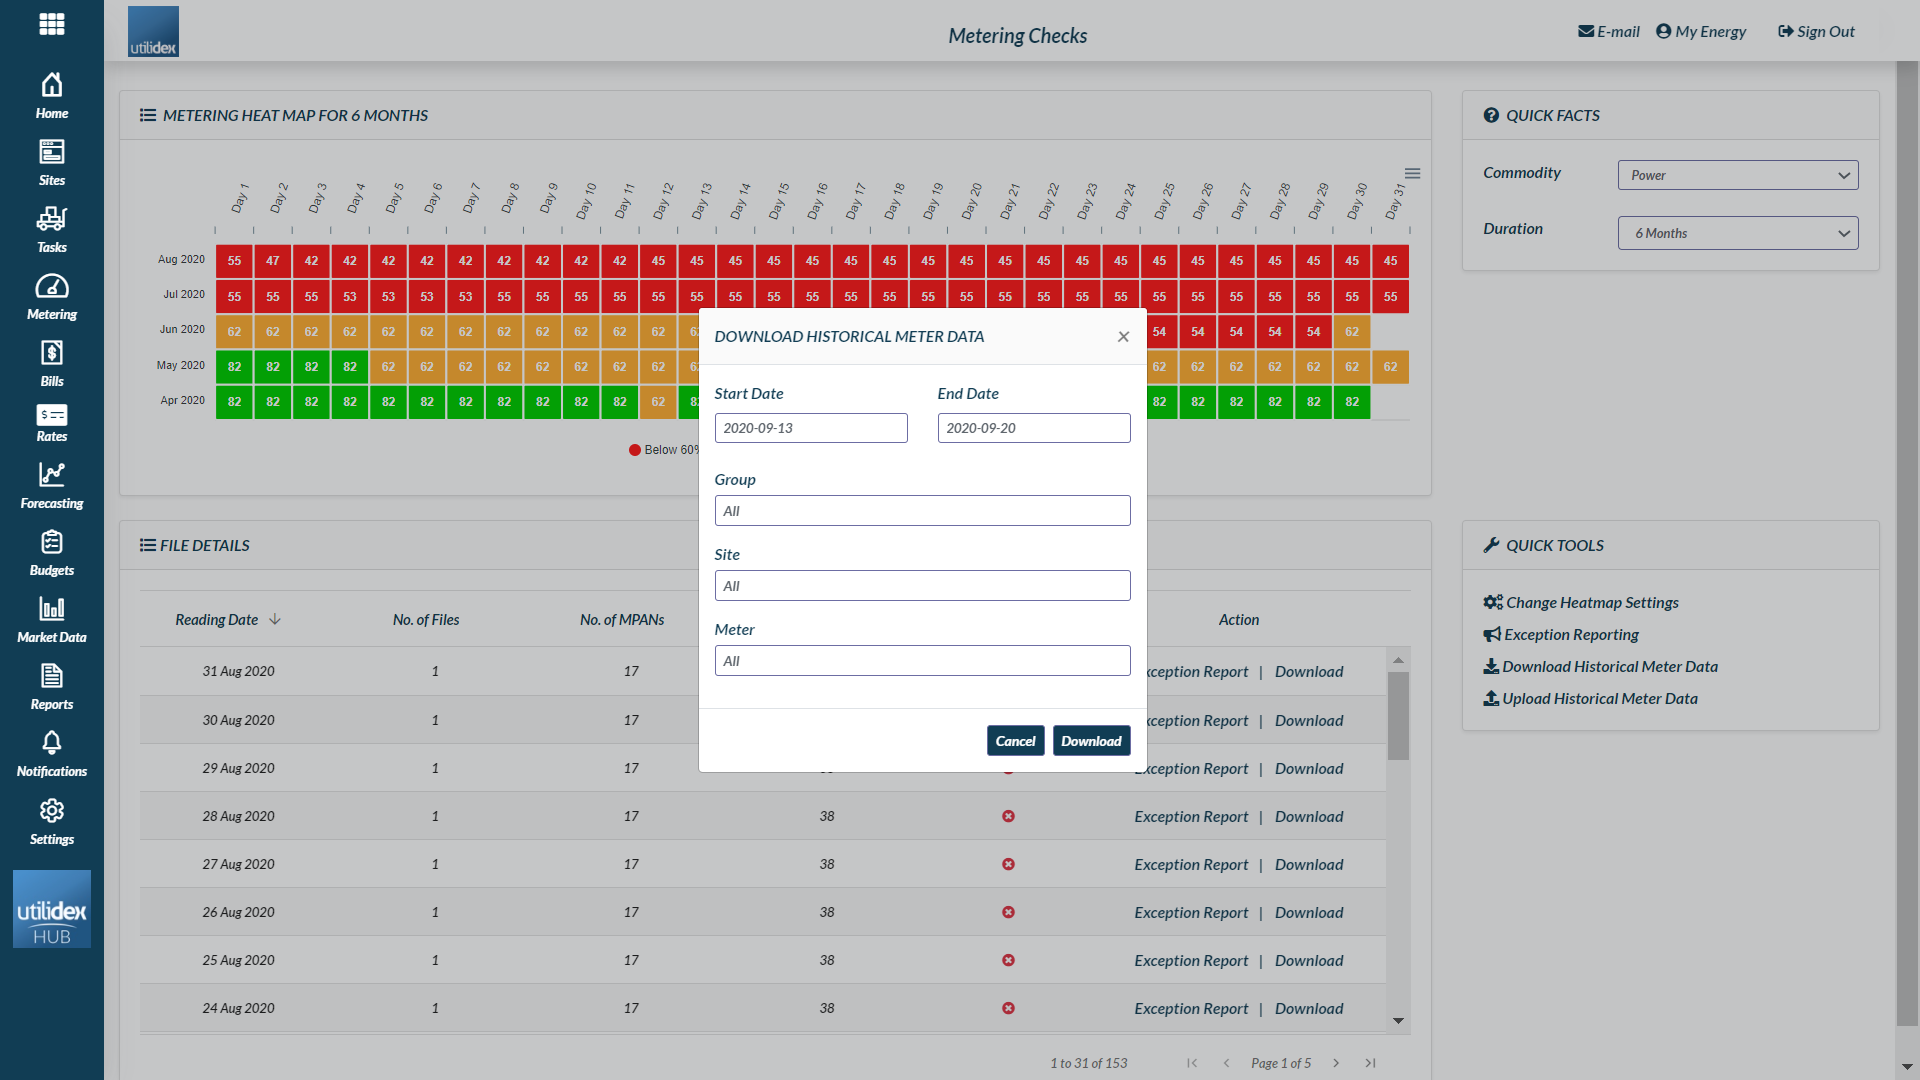
From the metering imports screen you can also download meter data histories. By selecting the Download historical meter data text in the quick tools on the right of the metering heat map, you will be presented with the below pop-up. Here you can select or search for MPAN’s/MPRN’s or define a group and then select a data range and the metering data is exported into Excel.
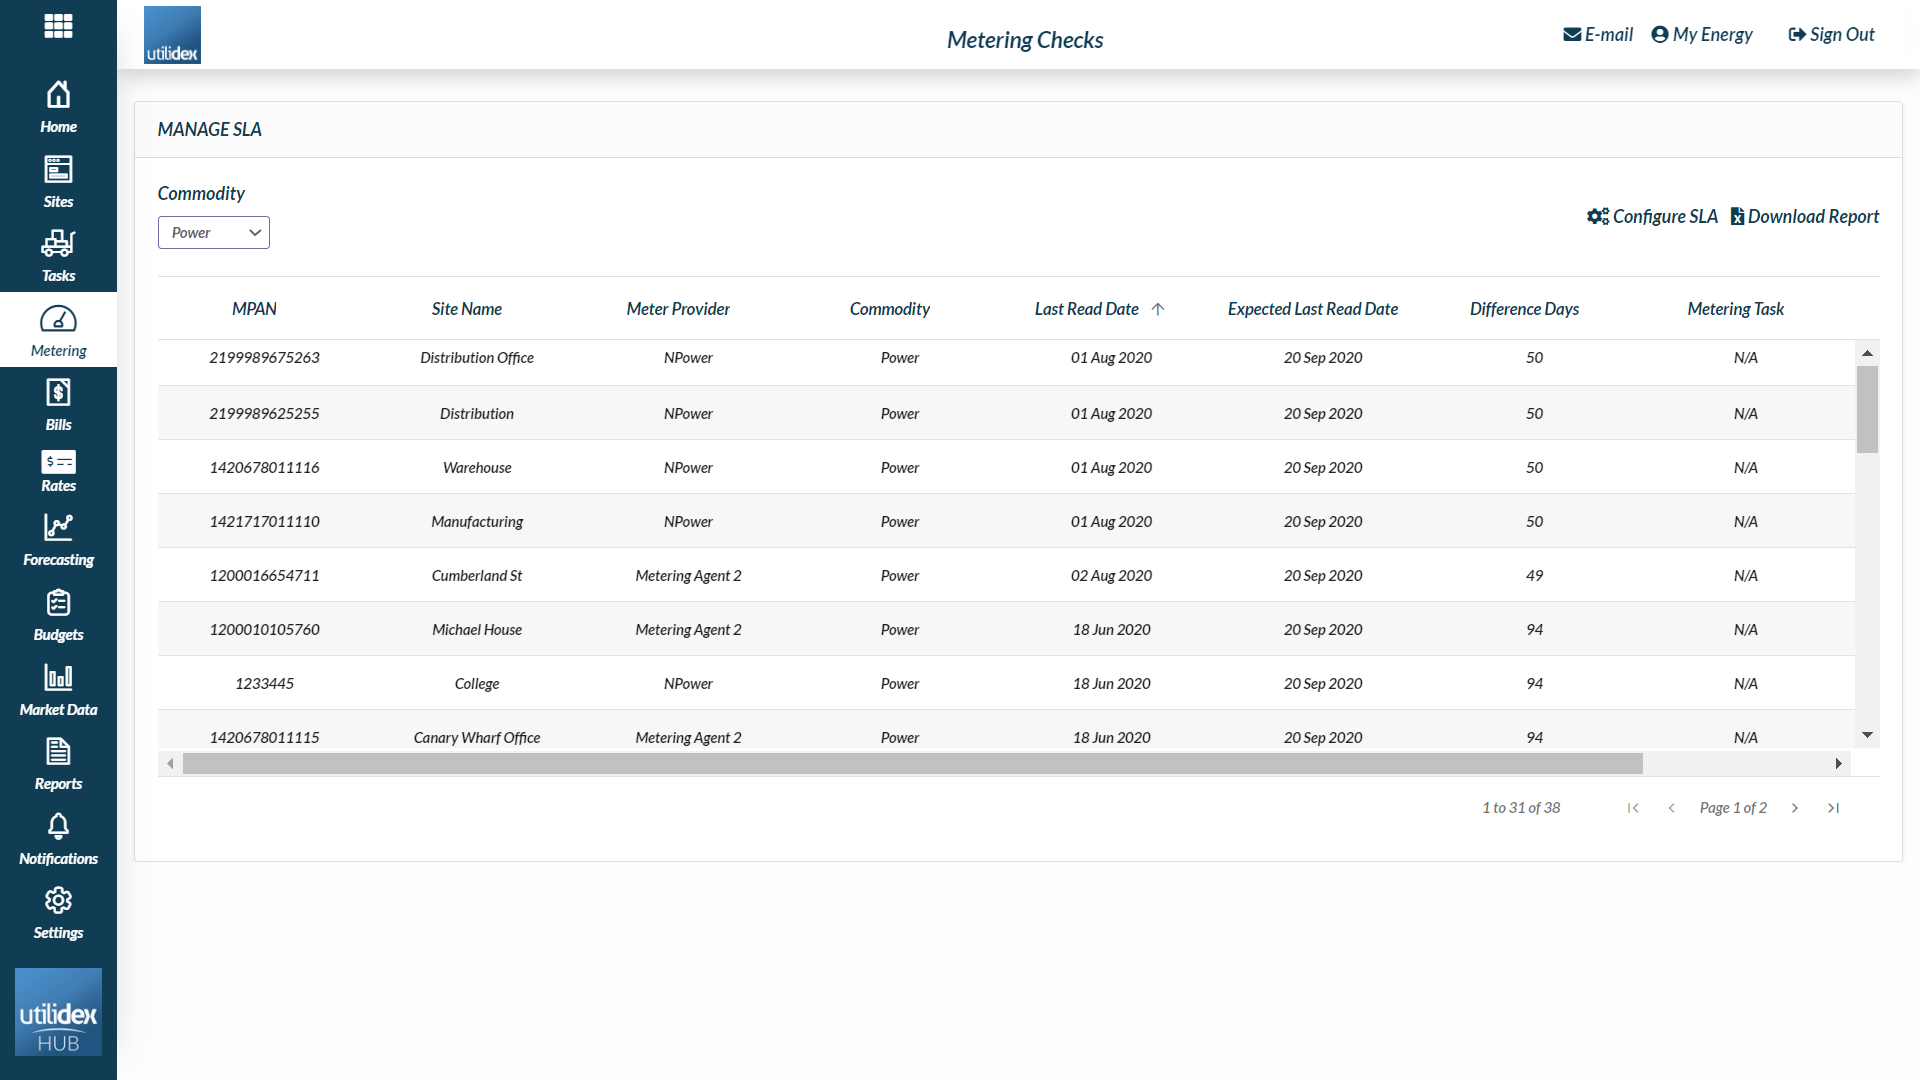
Running provider SLA reports
The metering heat map and supporting tools are there to allow you to manage and track your metering on a daily/weekly/monthly basis with your metering agents. You may also choose to put in place agreements around how frequently you should expect the data.
Known as an SLA (Service Level Agreements) you may request that your provider sends the meter data for all sites within 3-5 days. And that say 95% of meters should fall within this range.
The Meter SLA Reports help you track such agreements. Navigate to Metering >> Manage SLAs >> “Configure SLA”.
The below is the pop-up window that comes out, when you change the settings:
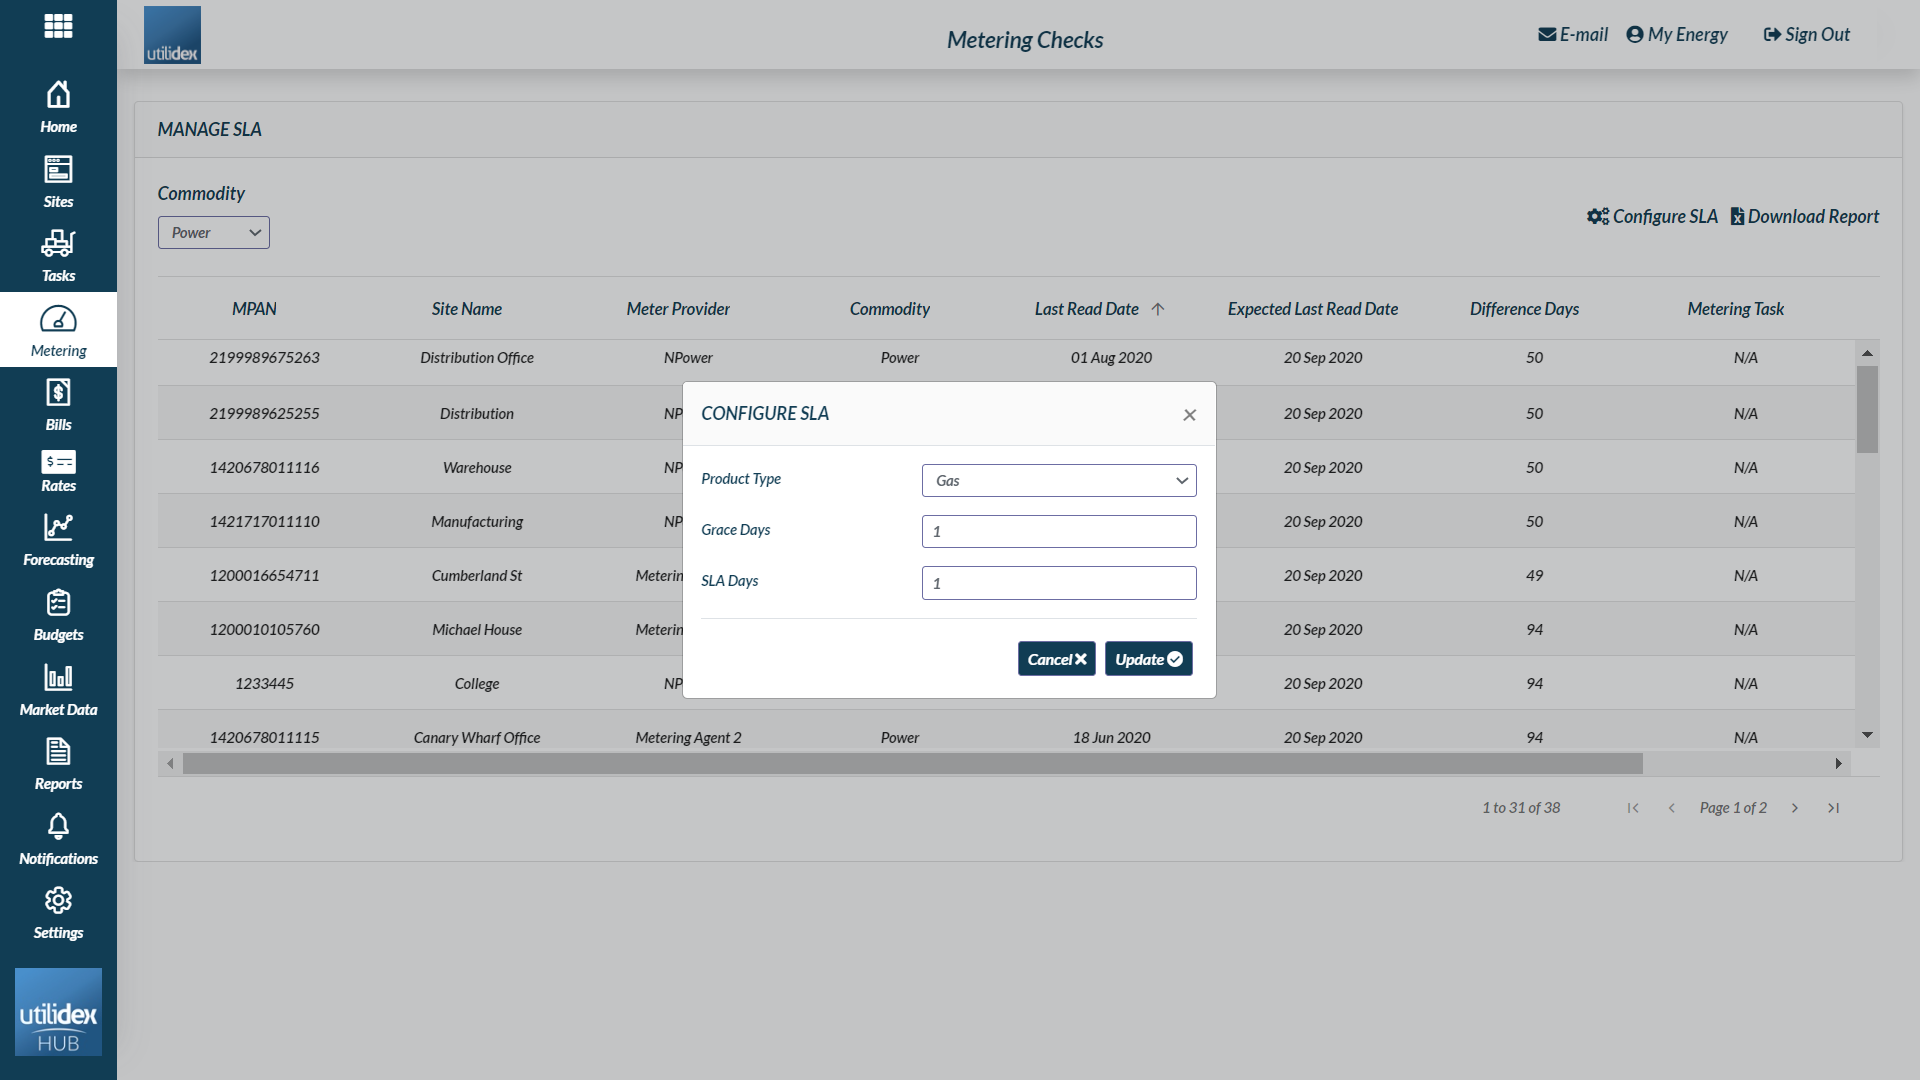
- Product Type: the Product Type is whether its Power or Gas
- Grace Days: the Grace days, is how much extra you wish to add on to your agreed SLA. You may simply put 0, or you may add some grace days.
- SLA Days: the SLA days is the agreed days that you have set with your service provider or an agreed internal SLA you have set, to measure against.
The Hub uses the Site Standing Data (Active Connections, plus Read Cycle Date to determine whether a site has breached its SLAs). The grid in the screen lists ALL sites where a breach has occurred, where the Difference Days is the difference between today and the expected last read date.
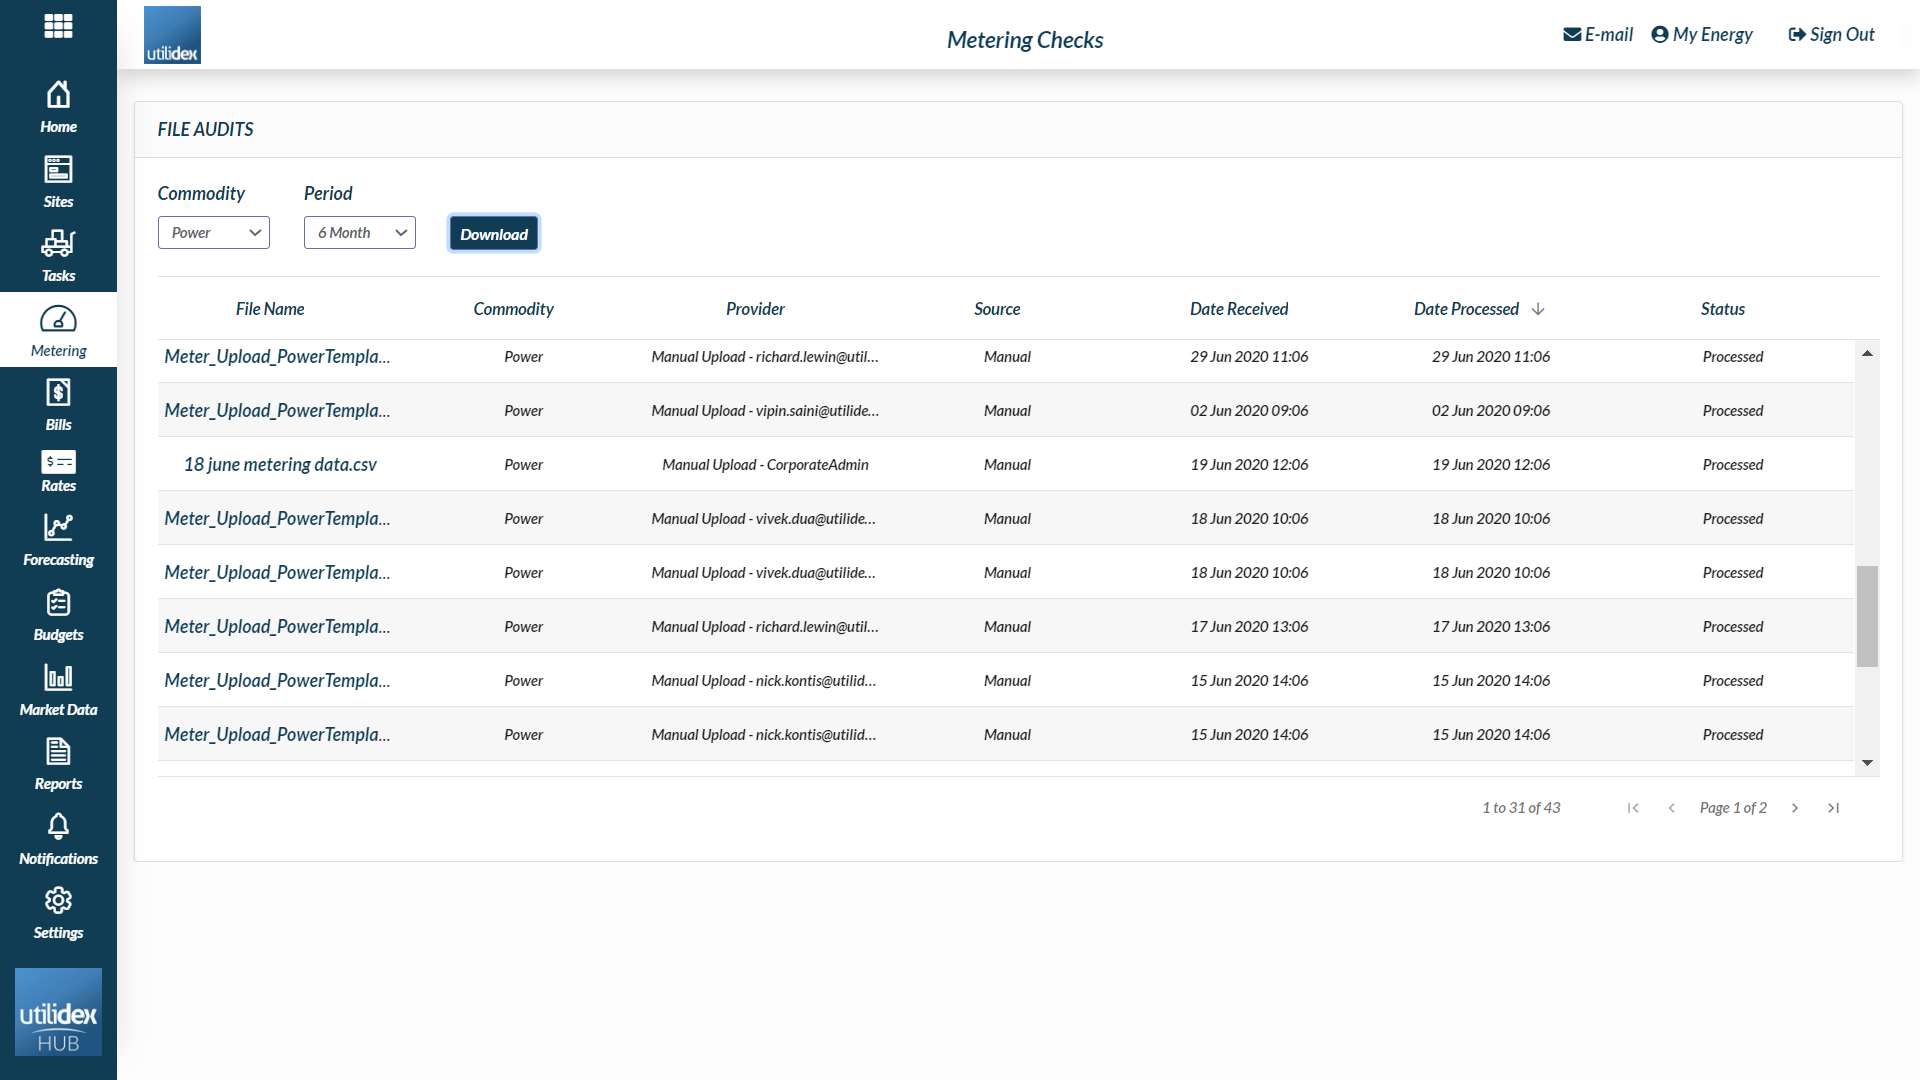
Track File Imports
It’s good to know when your metering files have arrived and at what time they were processed and made available in your Hub.
The Metering Audit user interface provides details of the time that metering files arrive in your system, the way in which they have been received (FTP/SFTP/Email/Manual Upload), and then the time they have been processed and updated throughout your Hub.
To access the metering file audit trail navigate to Metering >> Track File Imports.
Working with your data collectors to improve data quality
The Utilidex Hub provides a special type of user access for your metering provider, to allow them access to the metering screens and to see what data they are sending through.
Important: it’s best to check with your meter provider if they are happy to help share and resolve issues with you, via the Hub. This is something worth checking with your provider. We strongly recommend that customers find a way to work collaboratively with their metering companies, given that metering is a foundation activity, which underpins absolutely every other downstream process (billing, budgeting, flex trading, forecasting).