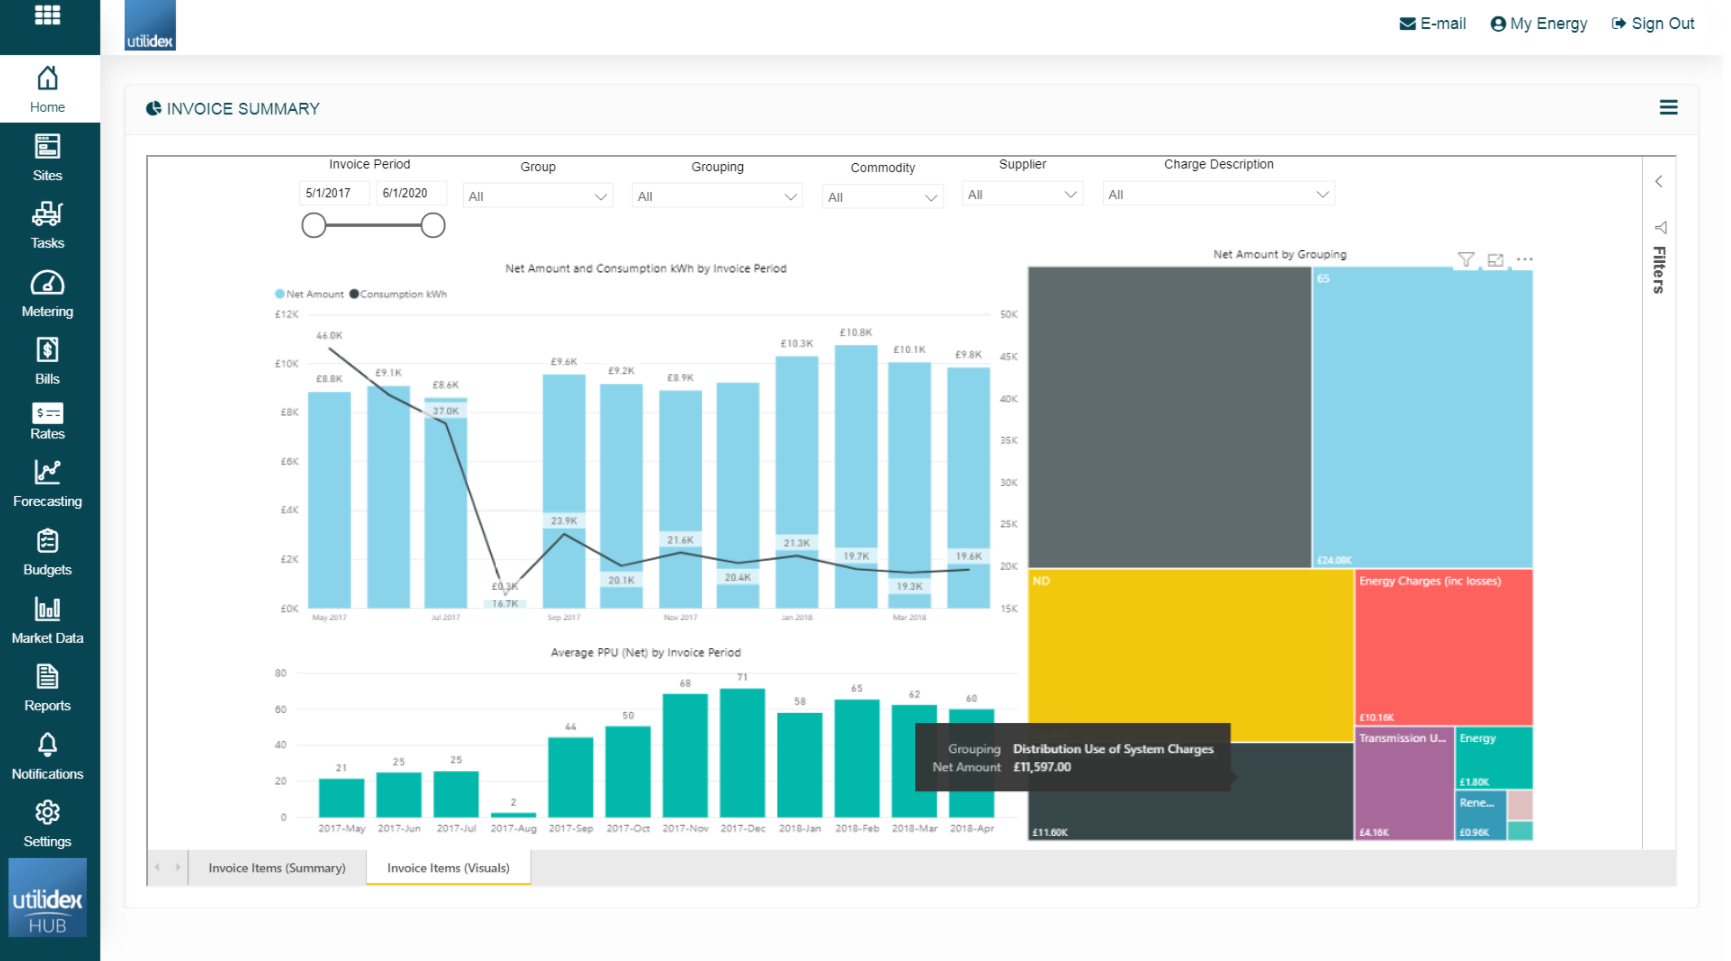
Like the Billing KPI dashboard, the Invoice Summary dashboard is another useful tool for the Billing Manager, Finance Manager and Procurement Specialists. Below is a screen shot of the current version within the Energy.Hub which can be found by navigating to Home >> Hub BI >> Invoice Summary.
Just as displayed in Excel, there are two worksheets contained within the report, these are Invoice Items (Summary) and Invoice Items (Visuals).
Here you can view the data, and can compare and filter using the below parameters:
- Invoice data range
- Group
- Commodity
- Grouping – Type of charging e.g. Energy, Renewable Energy, DUoS
- Charge Description – The actual item of charging
For the business users, it answers the following questions:
- What is the Net Amount by Group?
- What is the Net Amount by Commodity? What is the Net Amount by Supplier?
- What is the Net Amount and Consumption by Group, Month and Payment Status?