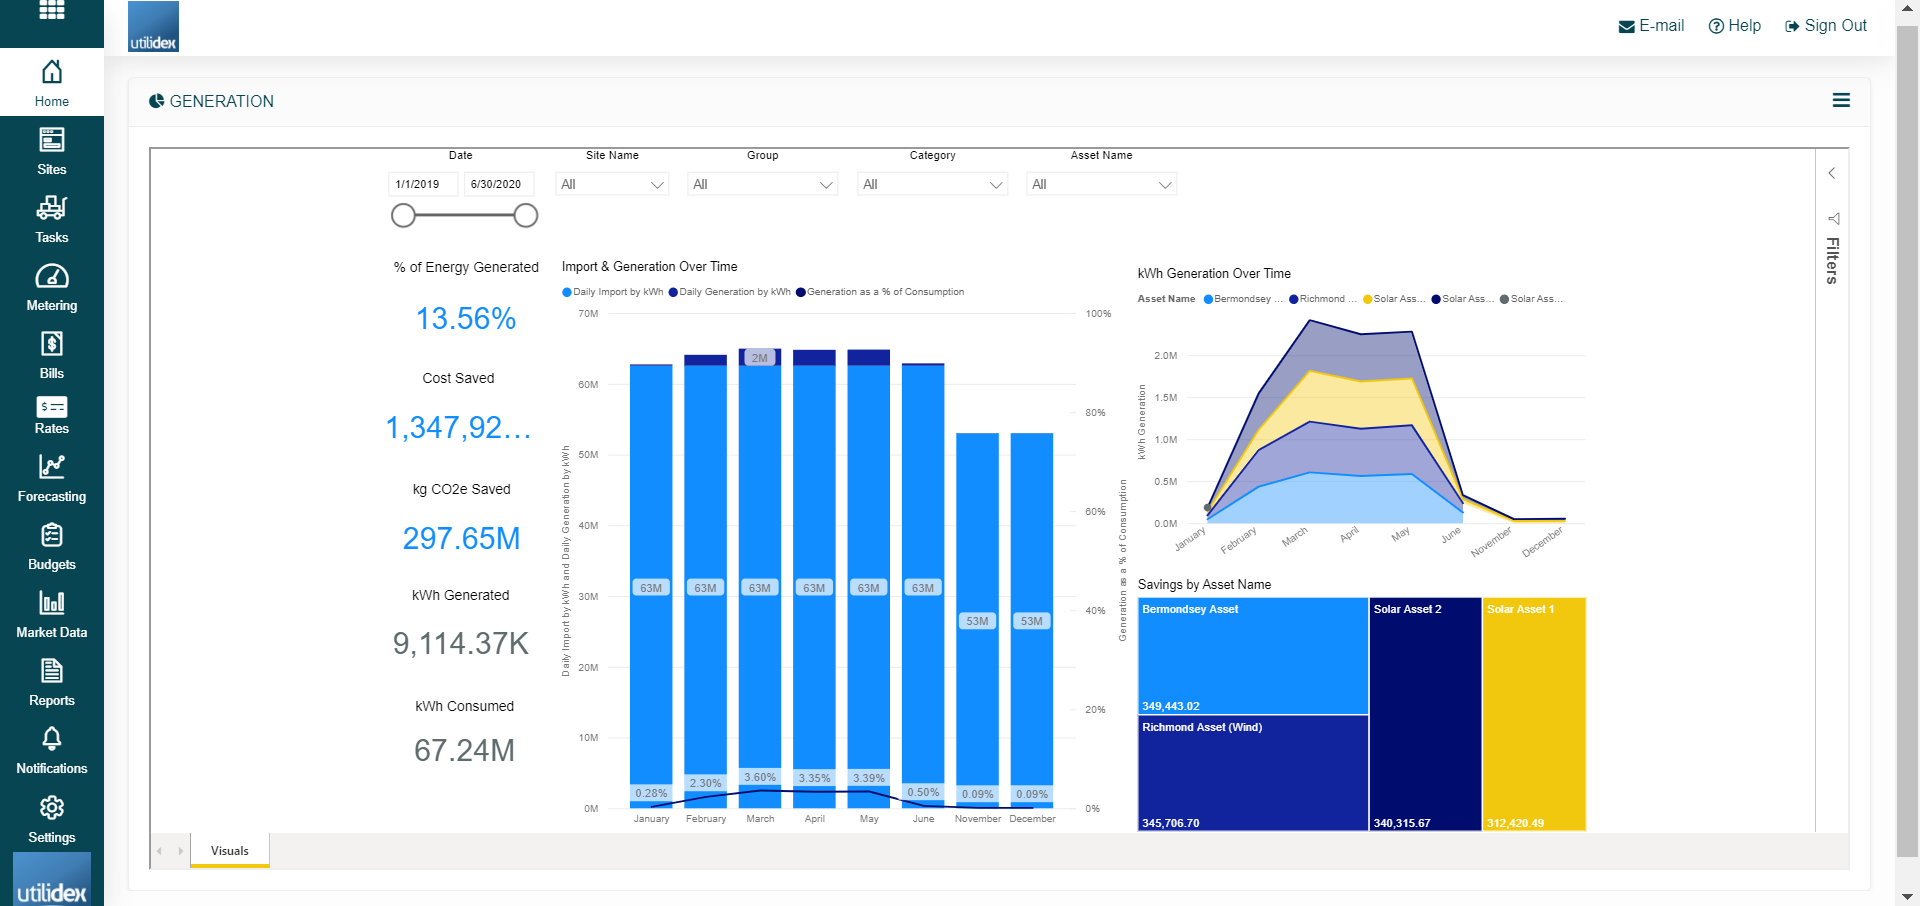
If you have generation assets connected to your sites, the Generation BI helps you get an understanding of your savings. The BI gives and overview of your asset generation compared to the total site consumption and it identifies cost, consumption & carbon savings generated by the connected assets.
The report has three main graphical representations:
- Import & Generation Over Time – this graph gives a view on the daily generation compared to the daily consumption of a site.
- KWh Generation Over Time – this graph shows the trend in the KWh generated over time for each assets present in the portfolio
- Savings by Asset Name – this graph gives a representation of which assets have generated for savings for the period selected.