Data is the cornerstone for all energy processes, so having a quick snapshot of what is missing, will help you manage estates much easier than before. By turning each missing data element into actionable information, the Energy.Hub ensures your data quality is always perfect.
The Data Quality Report provides a full picture of all the missing data elements required to accurately run the Energy.Hub’s energy products. Whether that’s data to complete energy management(site & meter), or bill processing(site, meter, tariffs & rates) or even helping user perform advanced analytics(site, meter & analytics), this reports let’s you know if you are ready.
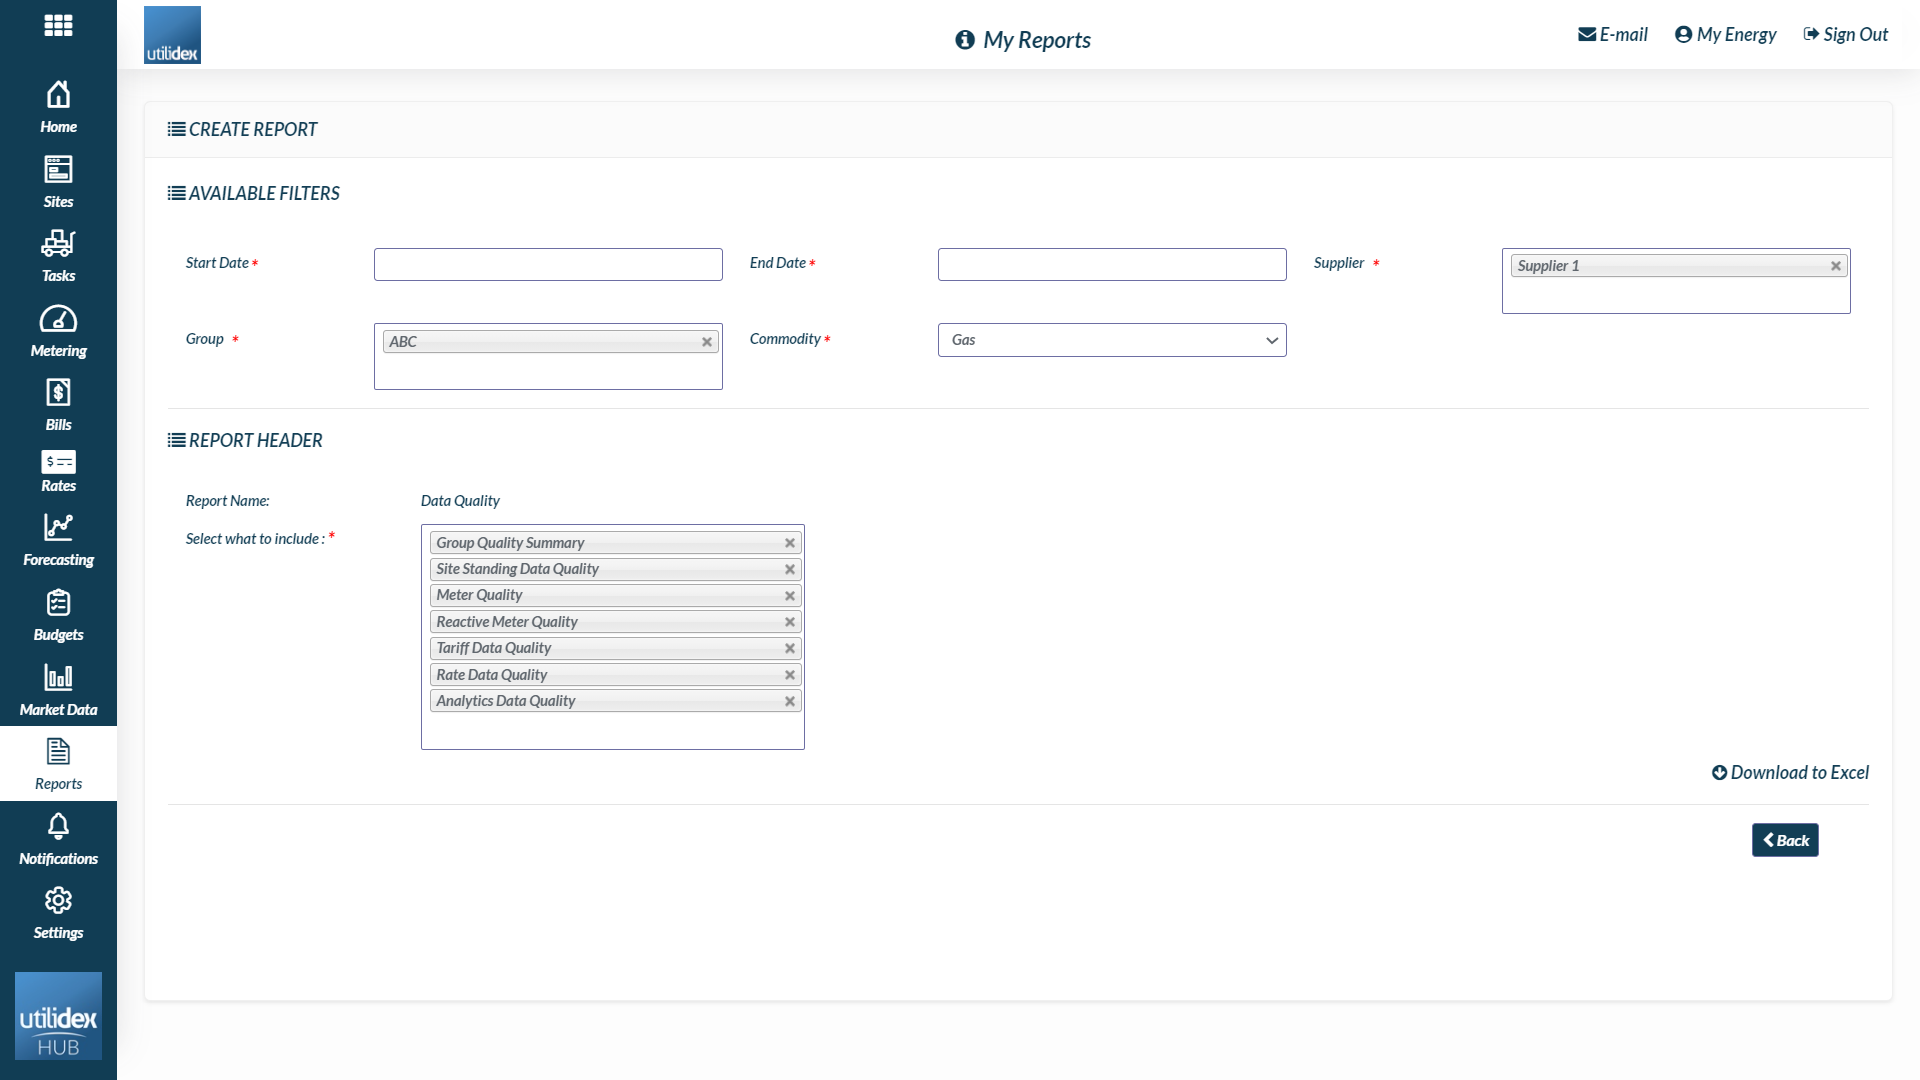
Navigate to Reports >> Generate Report >> Data Audit >> Data Quality.
How does it work?
The report checks the system for all your important data elements and create a checklist, as well as exception reports to show you what needs your attention. Effectively, this report acts as an energy manager telling you what areas of the system need more data before running the energy management, bill processing or analytics product. To do so, the report follows the following structure:
- A quality summary tab which displays data completion for each customer group and data element, as well as an indicator of the products available for your data quality.
- Detailed tabs for each of the data elements with actionable information that list out anything missing.
Group Quality Summary
Below is a screenshot of the summary tab, let’s try and go through it.
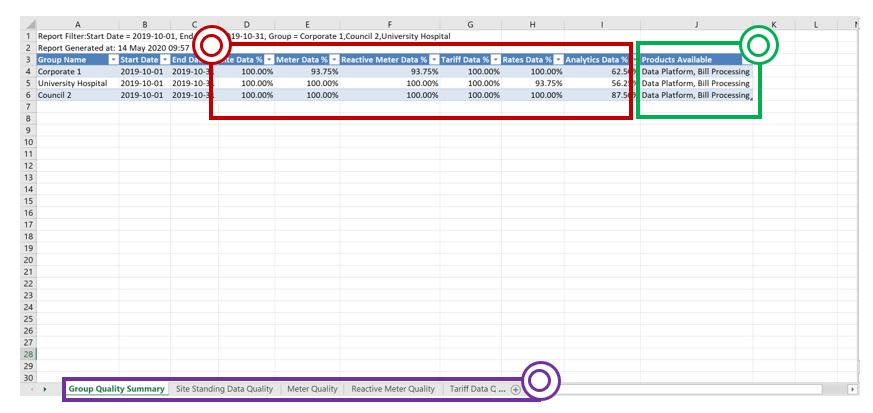
- The red section is where the data completion percentages per data element is shown for each group. These percentages give indications on what needs fixing. The goal is to hit the 100% completion mark. Therefore, any percentage lower than 100% should be targeted. These percentages are calculated as an expression of the number of meters you are missing data for, against the total number of meters you are expecting data for. This means that if data is present for 8 out of 10 meters and missing data for 2 meters, then the data completions is 80%.
- The green section is where you can see what products are available to run based on the data elements completion percentages. Below is a breakdown showing what elements are necessary for each of the products:
- Data Platform
- Site Data
- Meter Data
- Reactive Meter Data
- Data Platform
-
- Bill Processing
- Site Data
- Meter Data
- Reactive Meter Data
- Tariff Data
- Rates Data
- Bill Processing
-
- Analytics
- Site Data
- Meter Data
- Reactive Meter Data
- Analytics Data
- Analytics
- The purple section shows the available tabs you can navigate through to access the detailed exception reports for each. Please note that if the data element completion is at 100%, the respective tab will be blank as there are no exceptions(data missing). Now that we have gone through the Group Quality summary, let’s look into what each of the tabs show us. Below is a breakdown of the information displayed for each tab in the cases where there will be data missing.
Site Standing Data Quality
This tab will list out any mandatory site standing data fields missing for each MPAN/MPRN within a group.
Please note you can setup you own mandatory fields within the Site Data screen – navigate to Settings>Data Settings>Site Data or contact your account manager for more details.
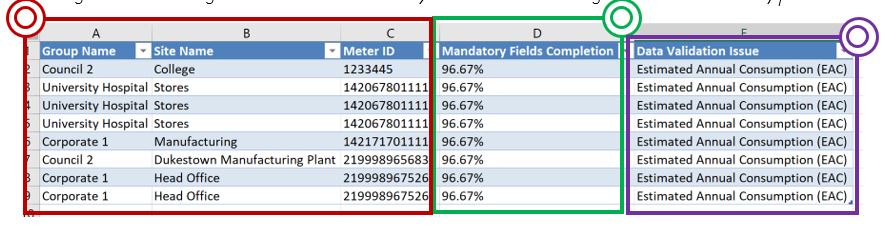
- The red section is where the key MPAN/MPRN identifiers will be listed, including customer group, site name and meter ID(MPAN or MPRN).
- The green section is where the data completion percentages per site are listed. These percentages give indications on what needs fixing on a site level. The goal is to hit the 100% completion mark. Therefore, any percentage lower than 100% should be targeted.
- The purple section is where the Data Fields missing for each MPAN/MPRN to reach 100% completion, will be listed. Once again, you can review the mandatory fields setup through your Site Data screen.
Meter Quality & Reactive Meter Quality
These tabs will list out any interval MPANs/MPRNs that are missing meter data for the period.
Please note these tabs only check for interval meters with a daily read frequency – you can check these fields within the Site CRM.
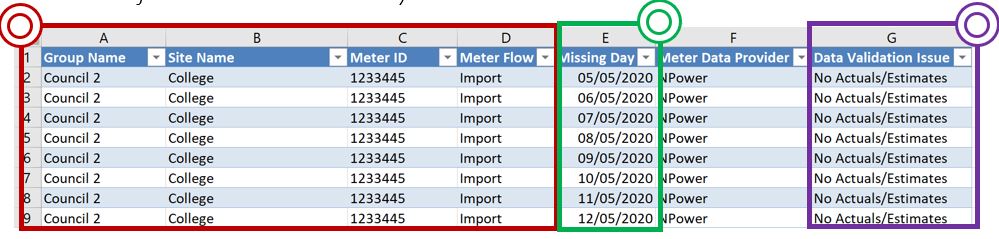
- The red section is where the key MPAN/MPRN identifiers will be listed, including customer group, site name and meter ID(MPAN or MPRN).
- The green section is where the days missing data are listed.
- The purple section is where any special data validation issues are listed. If no data is present, this will read “No Actuals/Estimates”.
Tariff Data Quality
This tab will list our any MPANs/MPRNs that do not have a tariff assigned to them. The tariff name is a standing data field. This means that it can be updated in bulk and the data element will remain completed.
Please note you can review the MPANs/MPRNs missing a tariff within the Portfolio list & the Site CRM.
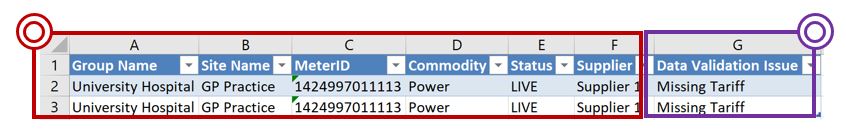
- The red section is where the key MPAN/MPRN identifiers will be listed, including customer group, site name and meter ID(MPAN or MPRN).
- The purple section is where the validation issue is listed. In this case, the message will read “Missing Tariff”.
Rate Data Quality
This tab will list out any rates missing for each MPANs/MPRNs based on the tariffs assigned.
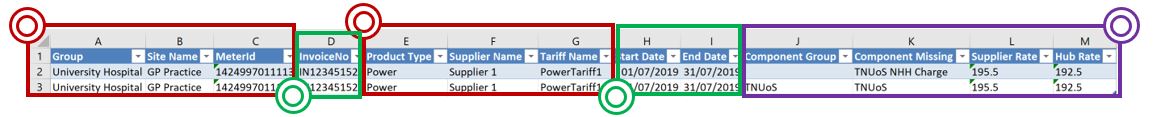
- The red section is where the key MPAN/MPRN identifiers will be listed, including customer group, site name, meter ID(MPAN or MPRN), Supplier & Tariff Name.
- The green section is where the key identifiers of the bill received for the period will be listed. This way, the user can identify which bill is used to compare and find differences between the rates.
- The purple section is where the details for any components that have different values or are missing will be listed. This will show both the supplier and the hub values for comparison purposes.
Analytics Data Quality
This tab will list out any MPANs/MPRNs that are missing site area or Site open/close times.
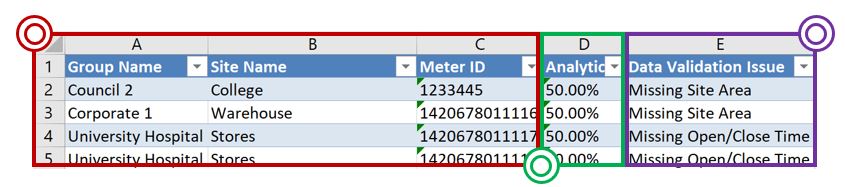
- The red section is where the key MPAN/MPRN identifiers will be listed, including customer group, site name and meter ID(MPAN or MPRN).
- The green section is where the data completion percentages per site are listed. These percentages give indications on what needs fixing on a site level. The goal is to hit the 100% completion mark. Therefore, any percentage lower than 100% should be targeted.
- The purple section is where the Data Fields missing for each MPAN/MPRN to reach 100% completion, will be listed. You can review the site area & open/close times through the Site CRM.