We have made it really easy for you to track energy performance with a new Consumption Benchmark KPI Business Intelligence dashboard, with the addition of Excel reporting. You can now compare yearly, monthly, weekly and daily consumption including carbon emissions, and track them from the BI dashboard.
Additionally, for those customers that buy energy by season, the report also includes the breakdown into Winter, Summer, Spring, and Autumn periods.
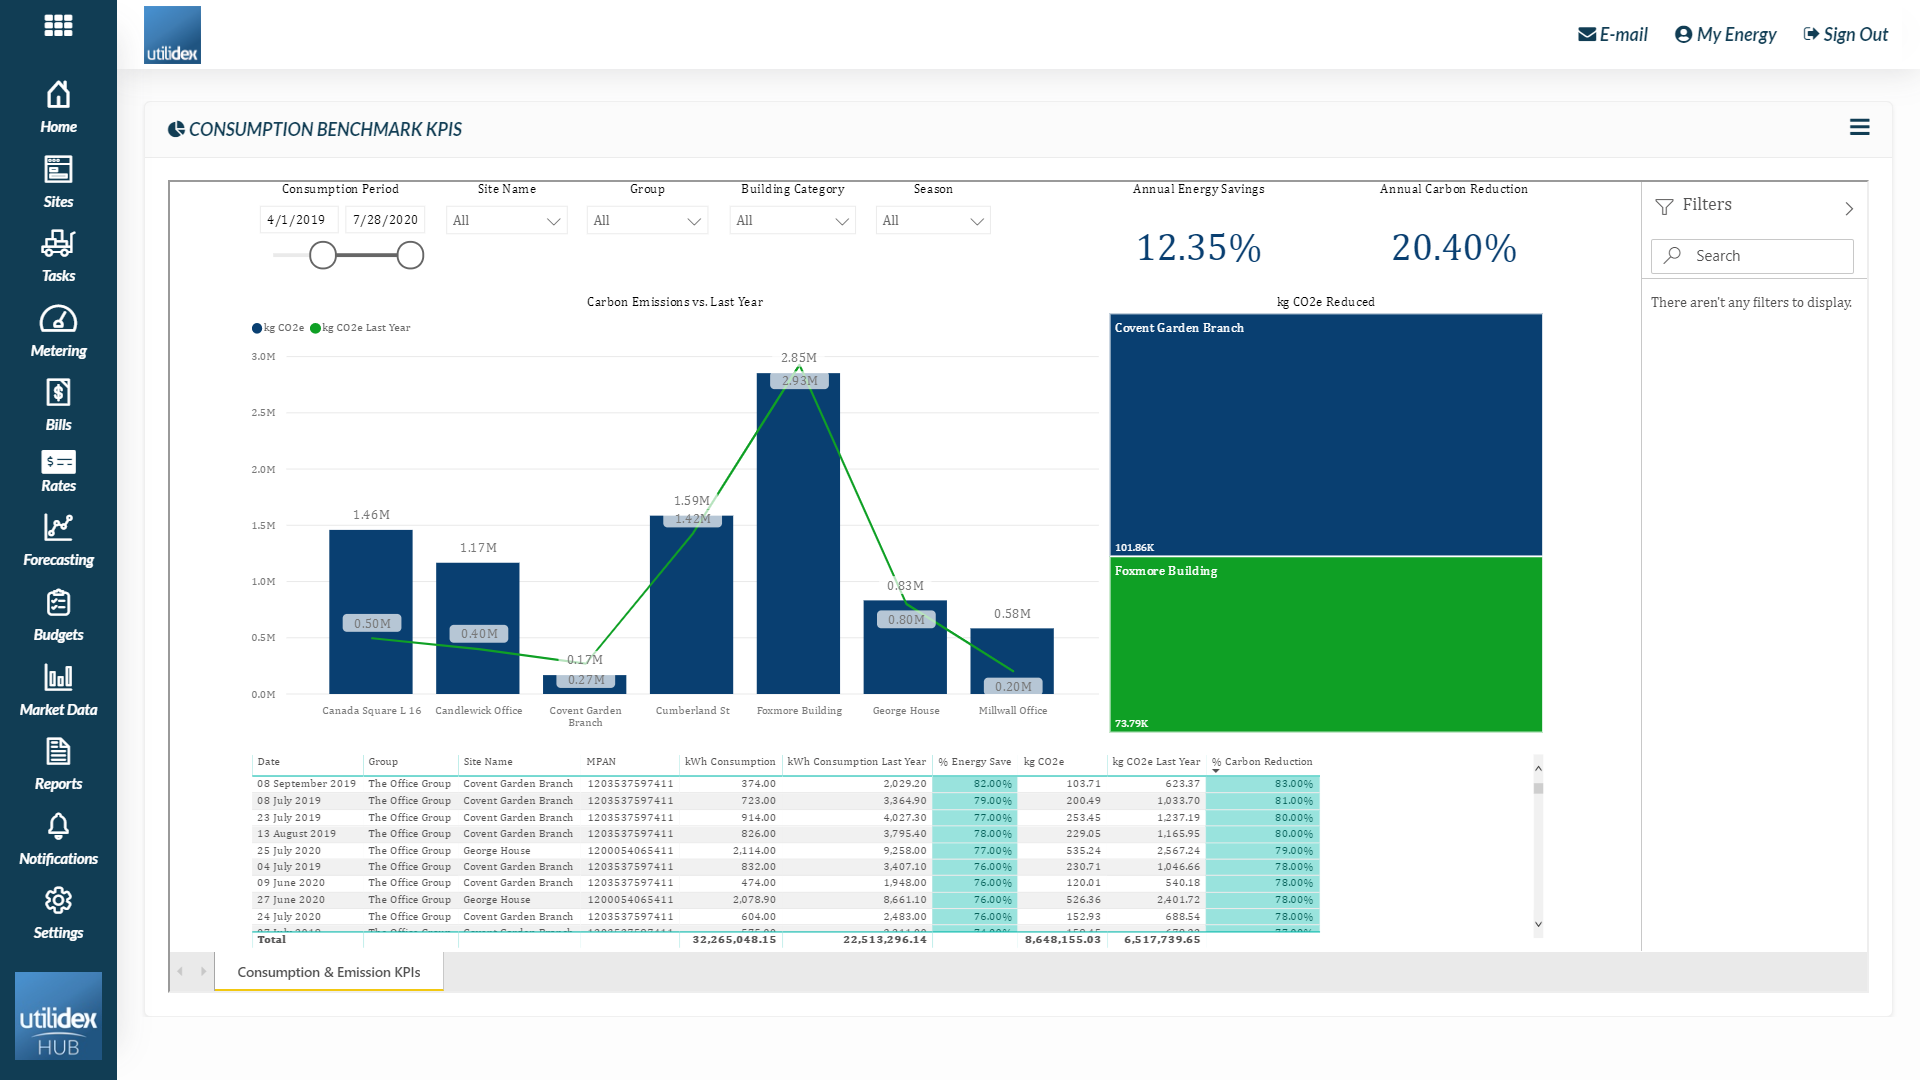
The BI shows the difference between the carbon emissions during the period you have selected through the filters and the same period last year. In this way, you can easily track any changes and trends to the carbon emissions.
You will also be able to see what sites have reduced their carbon emissions the most as well as the percentage of energy savings and carbon reduction.