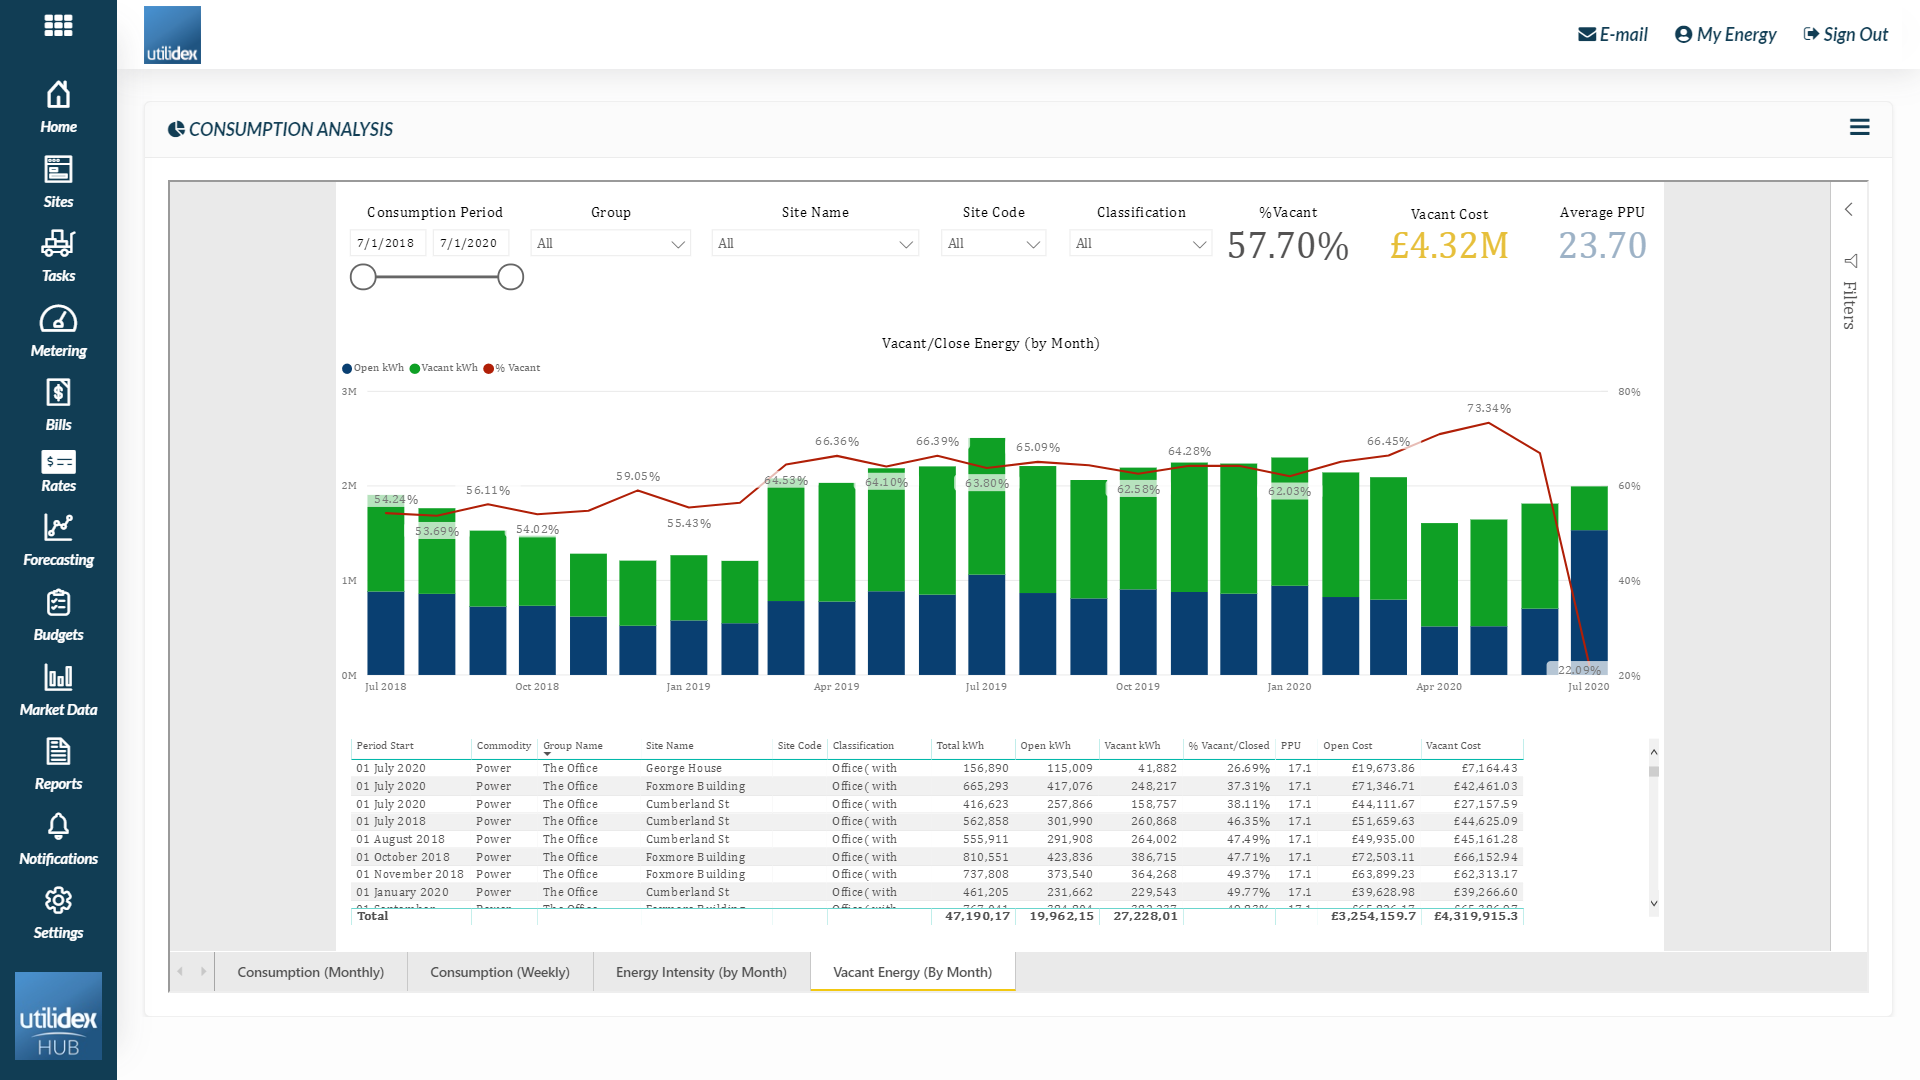
The Consumption Analysis BI provides useful information for Energy Managers and Data Analysts. It is also interesting for end users who want to gain a better understanding of their consumption profiles at their own sites. Below is a screen shot of the current version within the Energy.Hub which can be found by navigating to Home > Hub BI > Consumption Analysis.
There are four worksheets contained within the report, these are:
- Consumption (monthly) – This tab gives a representation of the difference between the planned and actual consumption over different months, highlighting the sites that have spent the most.
- Consumption (weekly) – This tab gives a representation of the difference between the planned and actual consumption over different weeks, highlighting the sites that have spent the most.
- Energy Intensity (by month) – This tab gives a representation of the difference of energy intensity depending on the floor area over different months, highlighting the sites with the higher energy intensity.
- Vacant Energy (by month) – This tab gives a representation of the vacant energy over different months, highlighting how many KWh and cost were spent on vacant energy
Here you can view the data, and can compare and filter using the below parameters:
- Invoice Date range
- Commodity
- Group
- Site
- Site Code
- Site Classification
For the business users, it answers the following questions:
- What is the Net Consumption of your Portfolio?
- What is the Net Amount by Group?
- What is the Net Amount by Site/Site Classification?
- Which sites are performing well/poorly inclusive of Group and Classification?
- What is the Vacant Energy usage?
You can analyse historical emissions data and consumption data across your sites and compare how they are doing.