The Budget Analysis dashboard provides useful information for Energy Managers and Finance Managers providing insights on the performance of their portfolio against set budgets. Please navigate to Home >> Hub BI >> Budget Analysis.
There are four worksheets contained within the report, these are Overspending Sites, Overspend Detail, Key KPIs and Budget Details.
Here you can view the data, and can compare and filter using the below parameters:
- Invoice Date range
- Commodity
- Group
- Supplier
- Site
- Budget
For the business users, it answers the following questions:
- What is the Planned and Actual consumption?
- What is the Planned and Actual cost?
- How much Under or Over Budget are you in both Consumption and Cost?
- Which sites are performing well/poorly inclusive of Group and Classification.
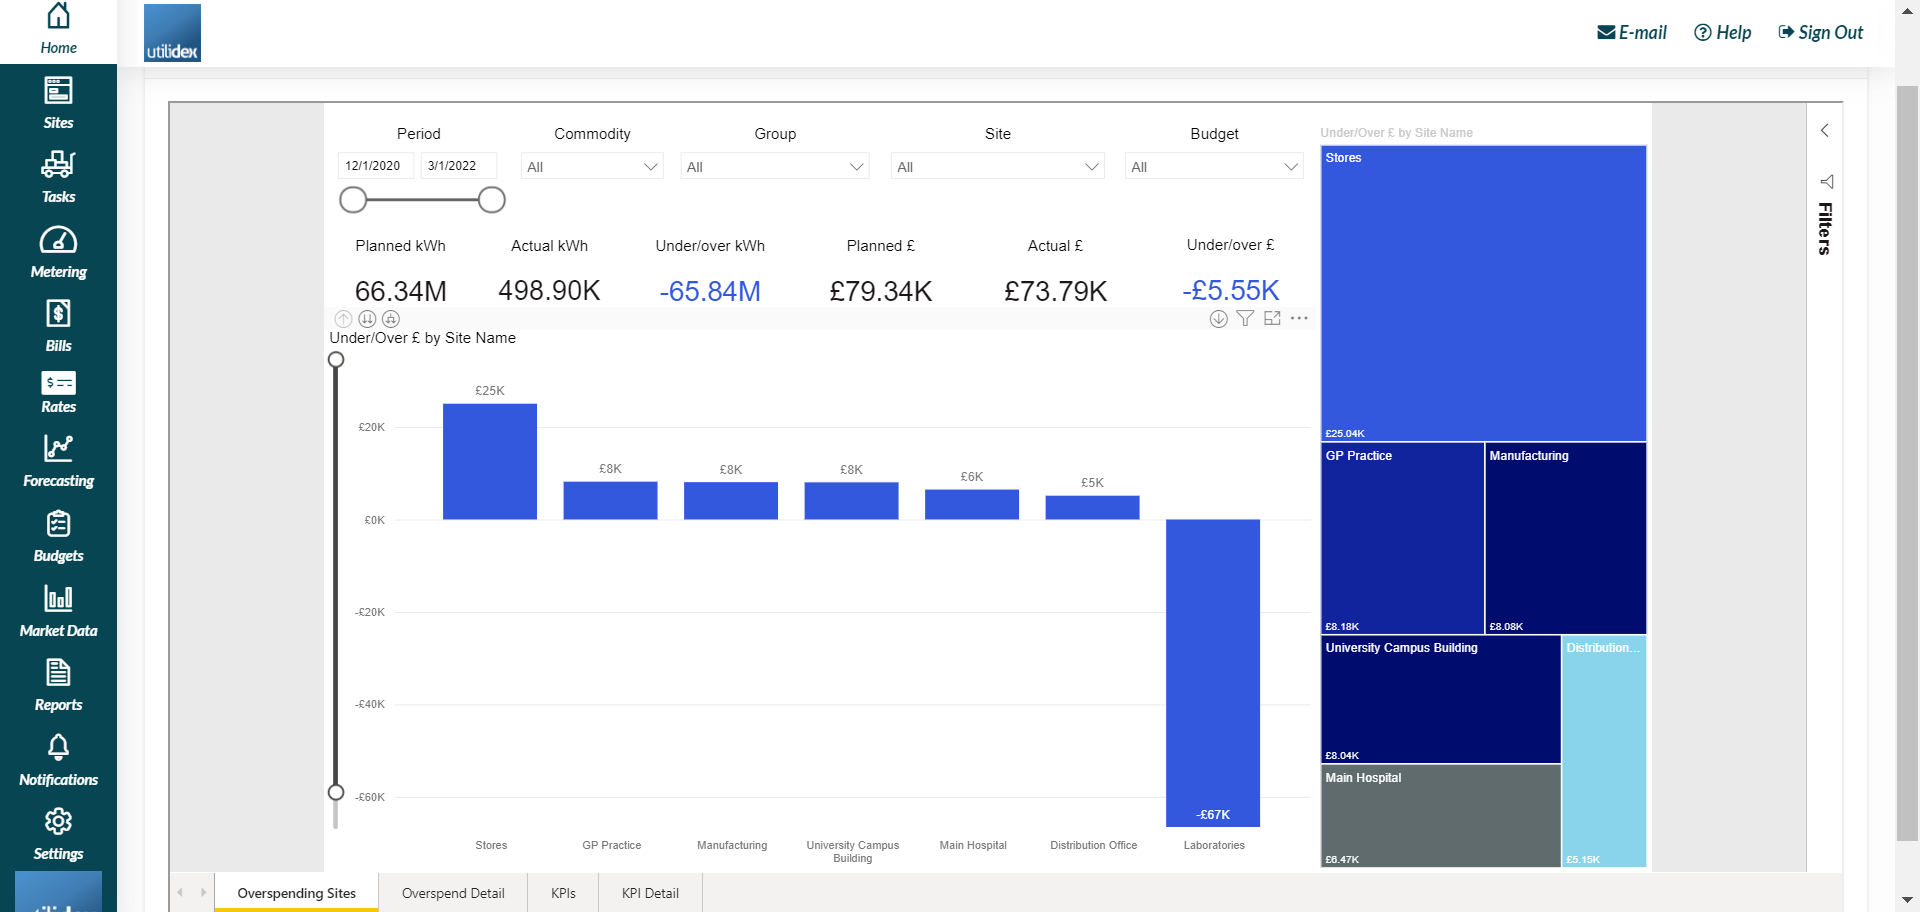
Overspending Sites
In this tab you can have an overview of the sites that are over and under spending. For a specific Period, Commodity, Group and Budget, you can view the over/under spending sites and the amount of money for which they are over/under spending. You can also decide to show the information either by group or by single sites, depending on the level of detail you would like to show.
Moreover, there are six KPI available, thanks to which you can have a quick view of the following information:
- Planned KWh – the consumption you planned to consume
- Actual KWh – the consumption you actually consumed
- Under/Over KWh – consumption differing from the planned one
- Planned £ – the amount of money you planned to spend
- Actual £ – the amount of money you actually spent
- Under/Over £ – amount of money differing from the planned one
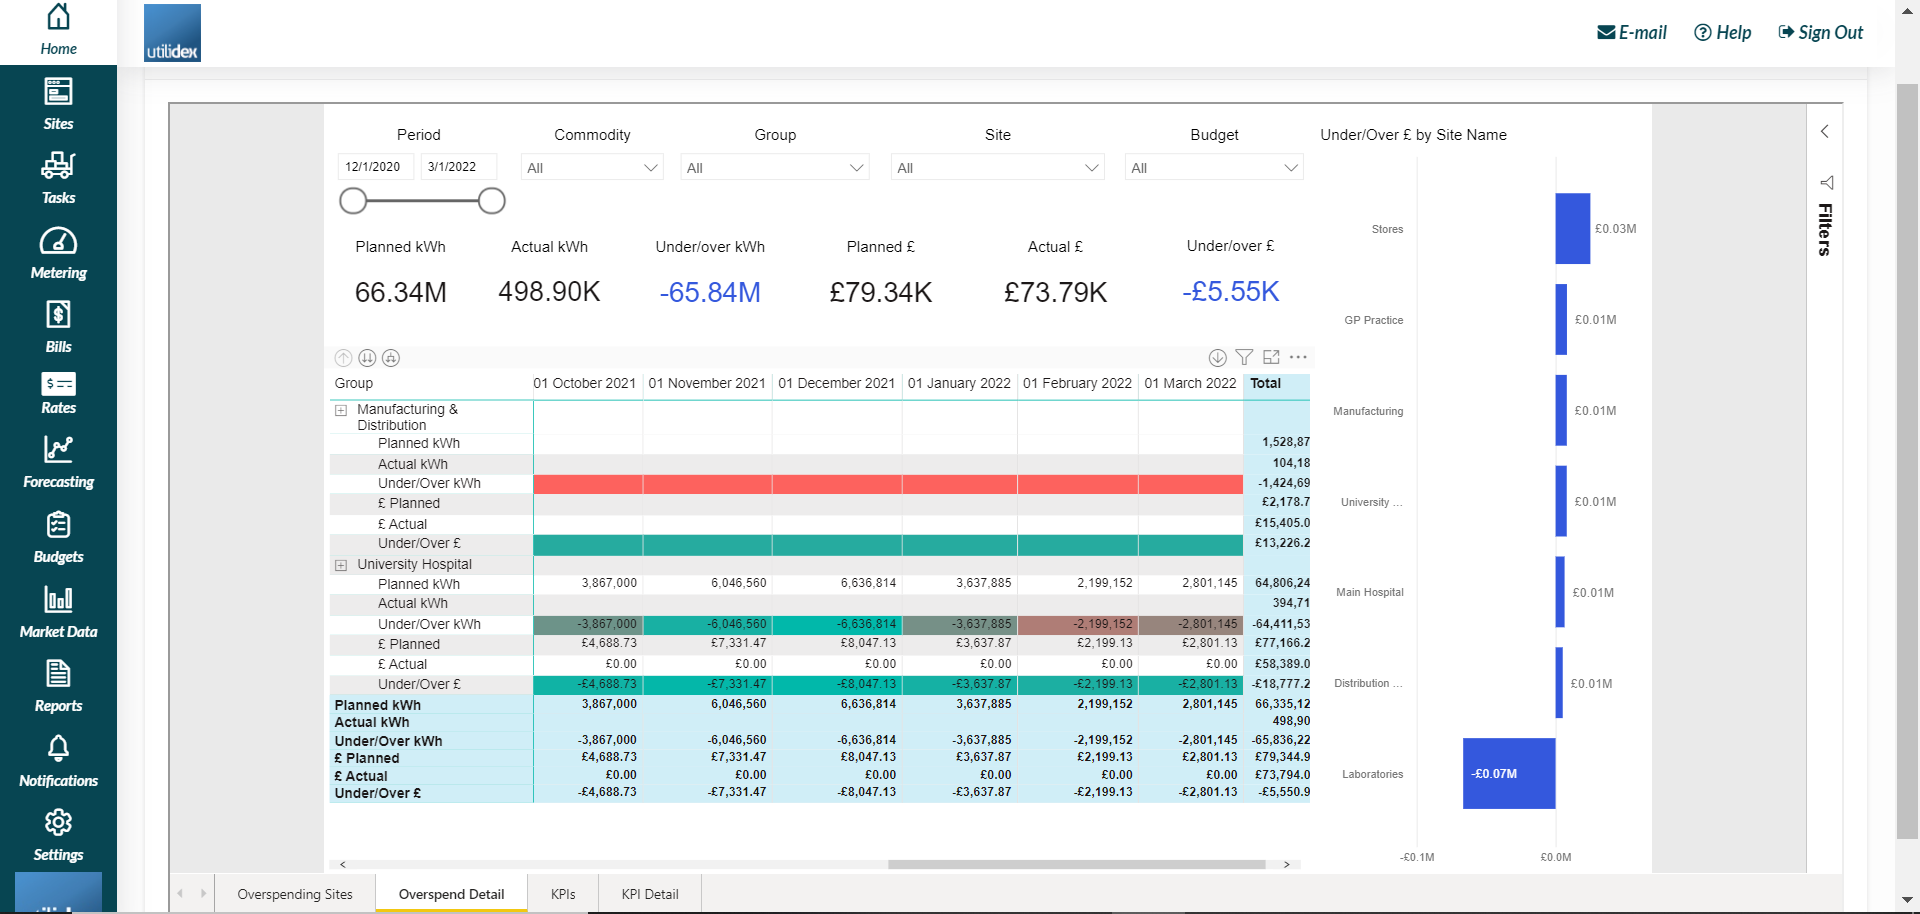
Overspend Detail
In this tab you can have an overview of the consumption and amount of money spent per group and sites. You can see the information per single months for the period of time you chose and on the right end side of the table you can see the total figures per planned and actual budget.
You can decide to view the information per group or per site by clicking on the two arrows that appear on the left end side of the table.
The same KPIs as shown above are also present in this tab.
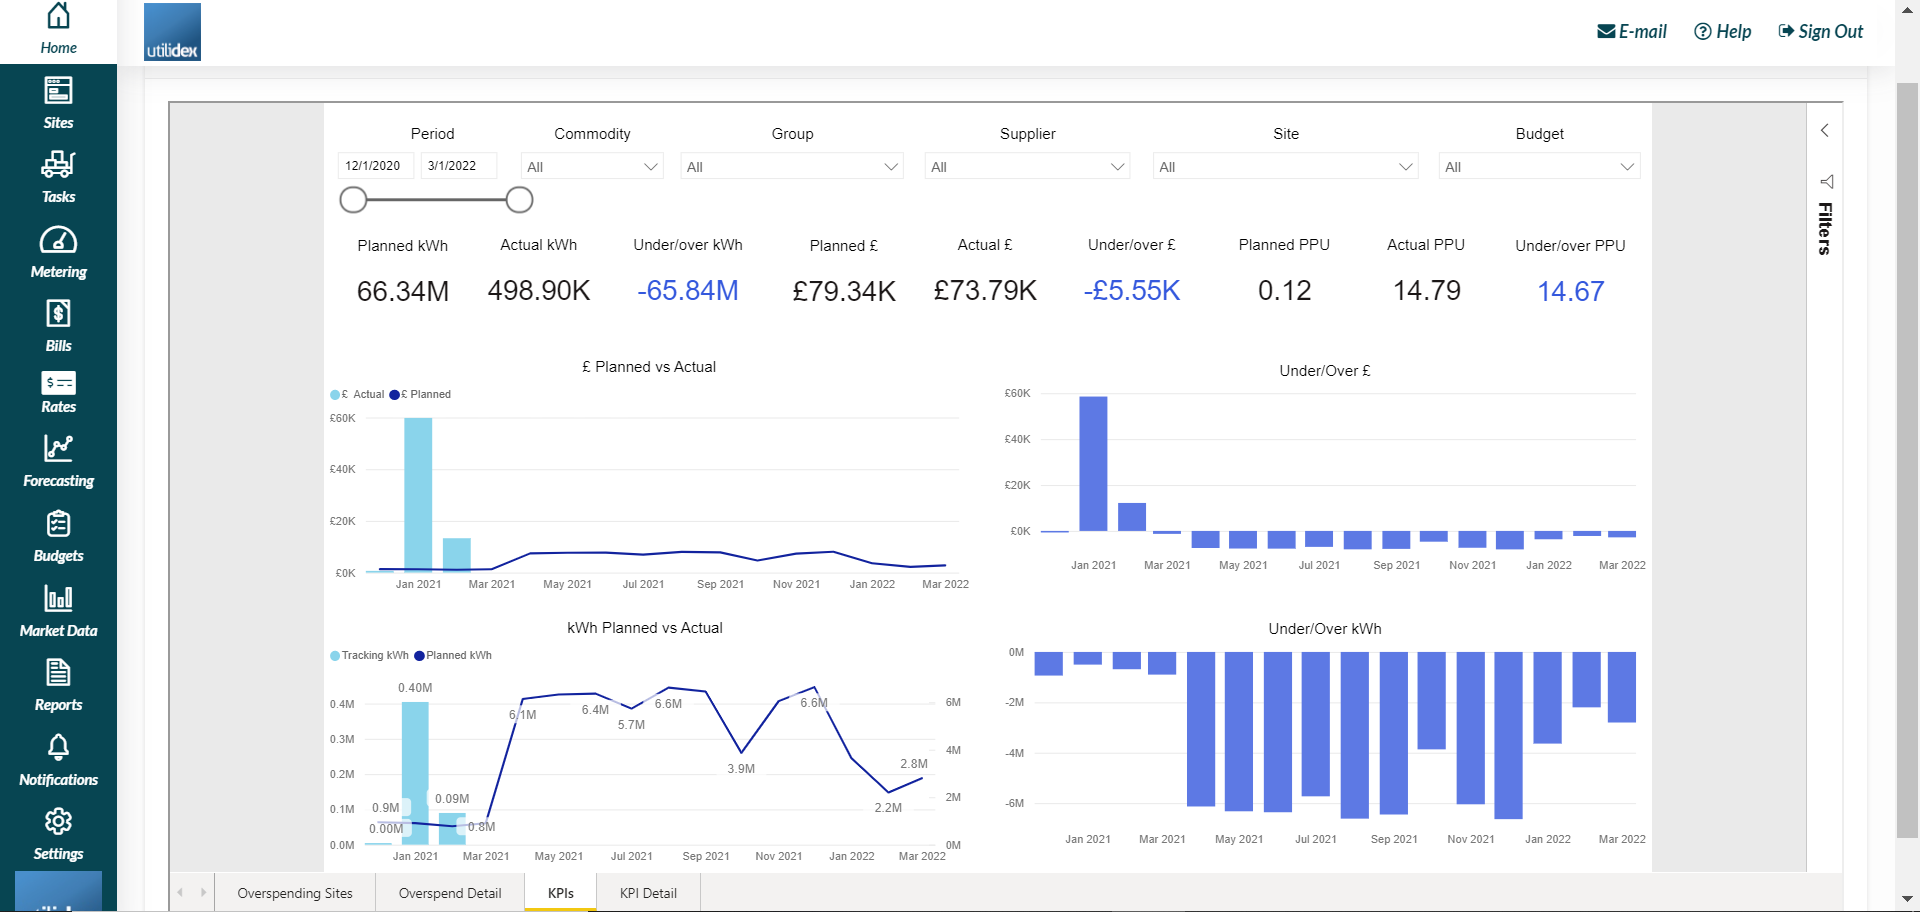
Key KPIs
In this tab there are four graphs available:
- £ Planned vs Actual – The the difference between the amount of money you planned to spend and the amount of money you actually spent
- KWh Planned vs Actual – the difference between the planned consumption and the actual consumption
- Under/Over £ – amount of money differing from the planned one
- Under Over KWh – consumption differing from the planned one
The tab also shows all the KPIs shown above, plus three more:
- Planned PPU
- Actual PPU
- Under/Over PPU
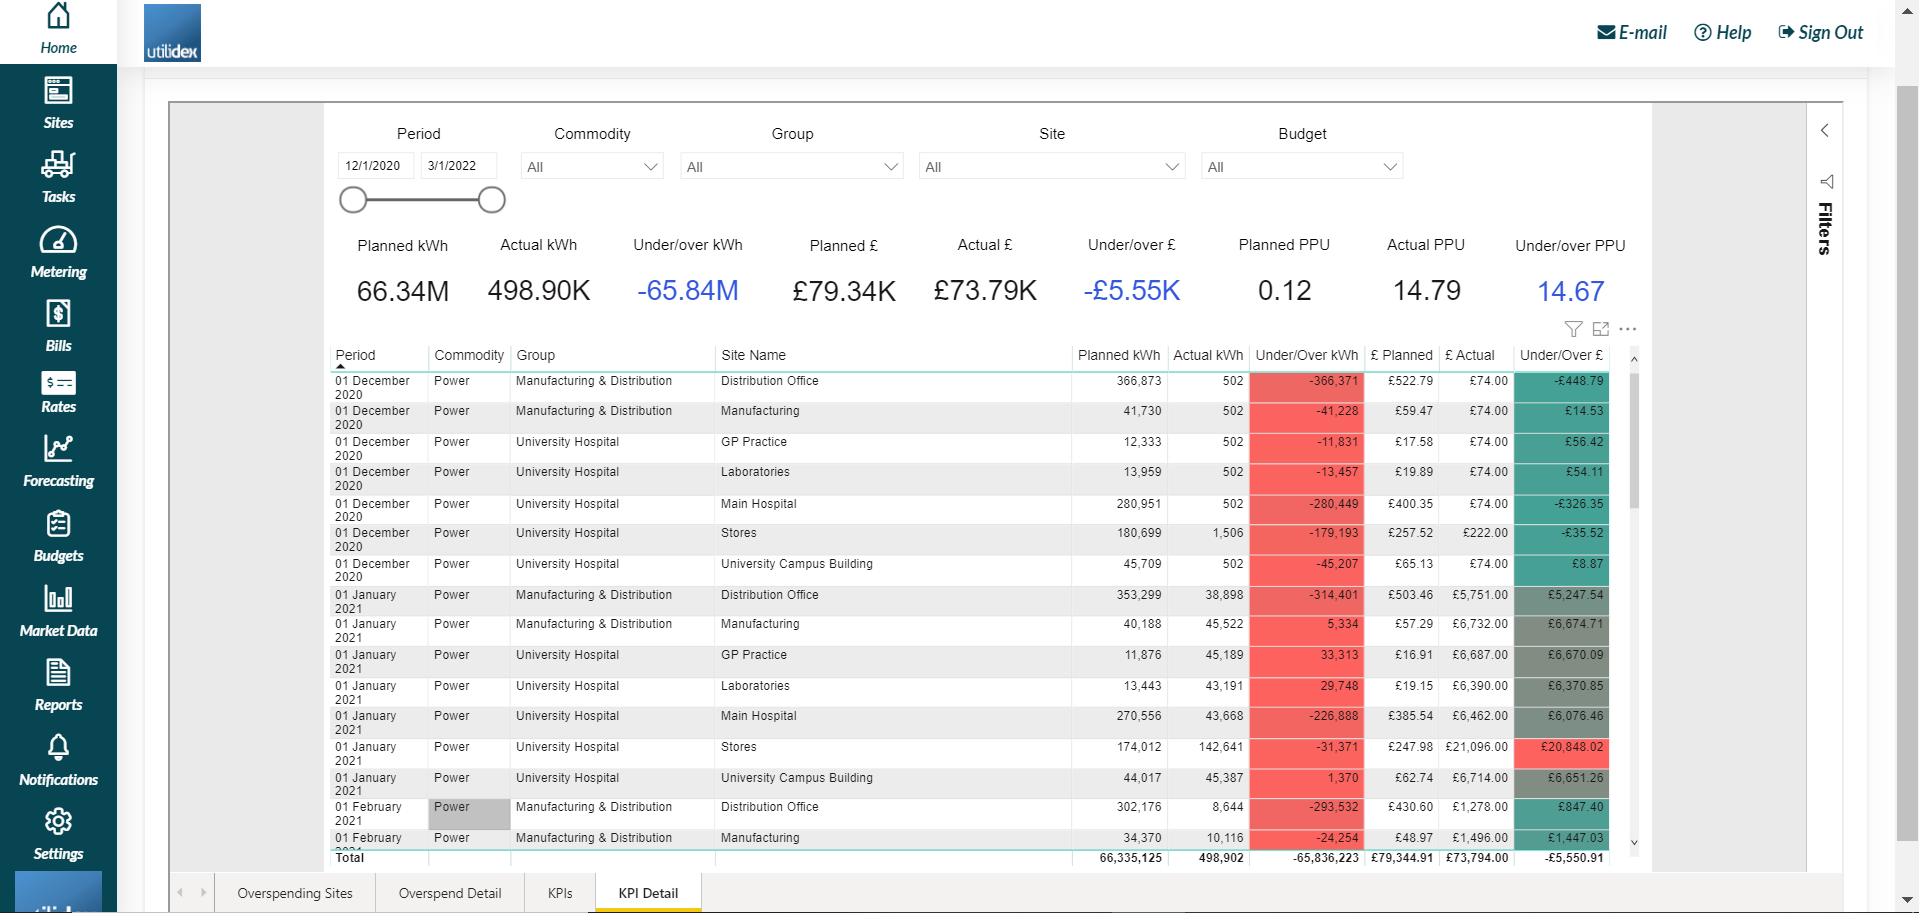
Budget Details
In this tab, the table gives you an overview of the sites in your portfolio and highlights any differences in the planned and actual consumption and amount of money.