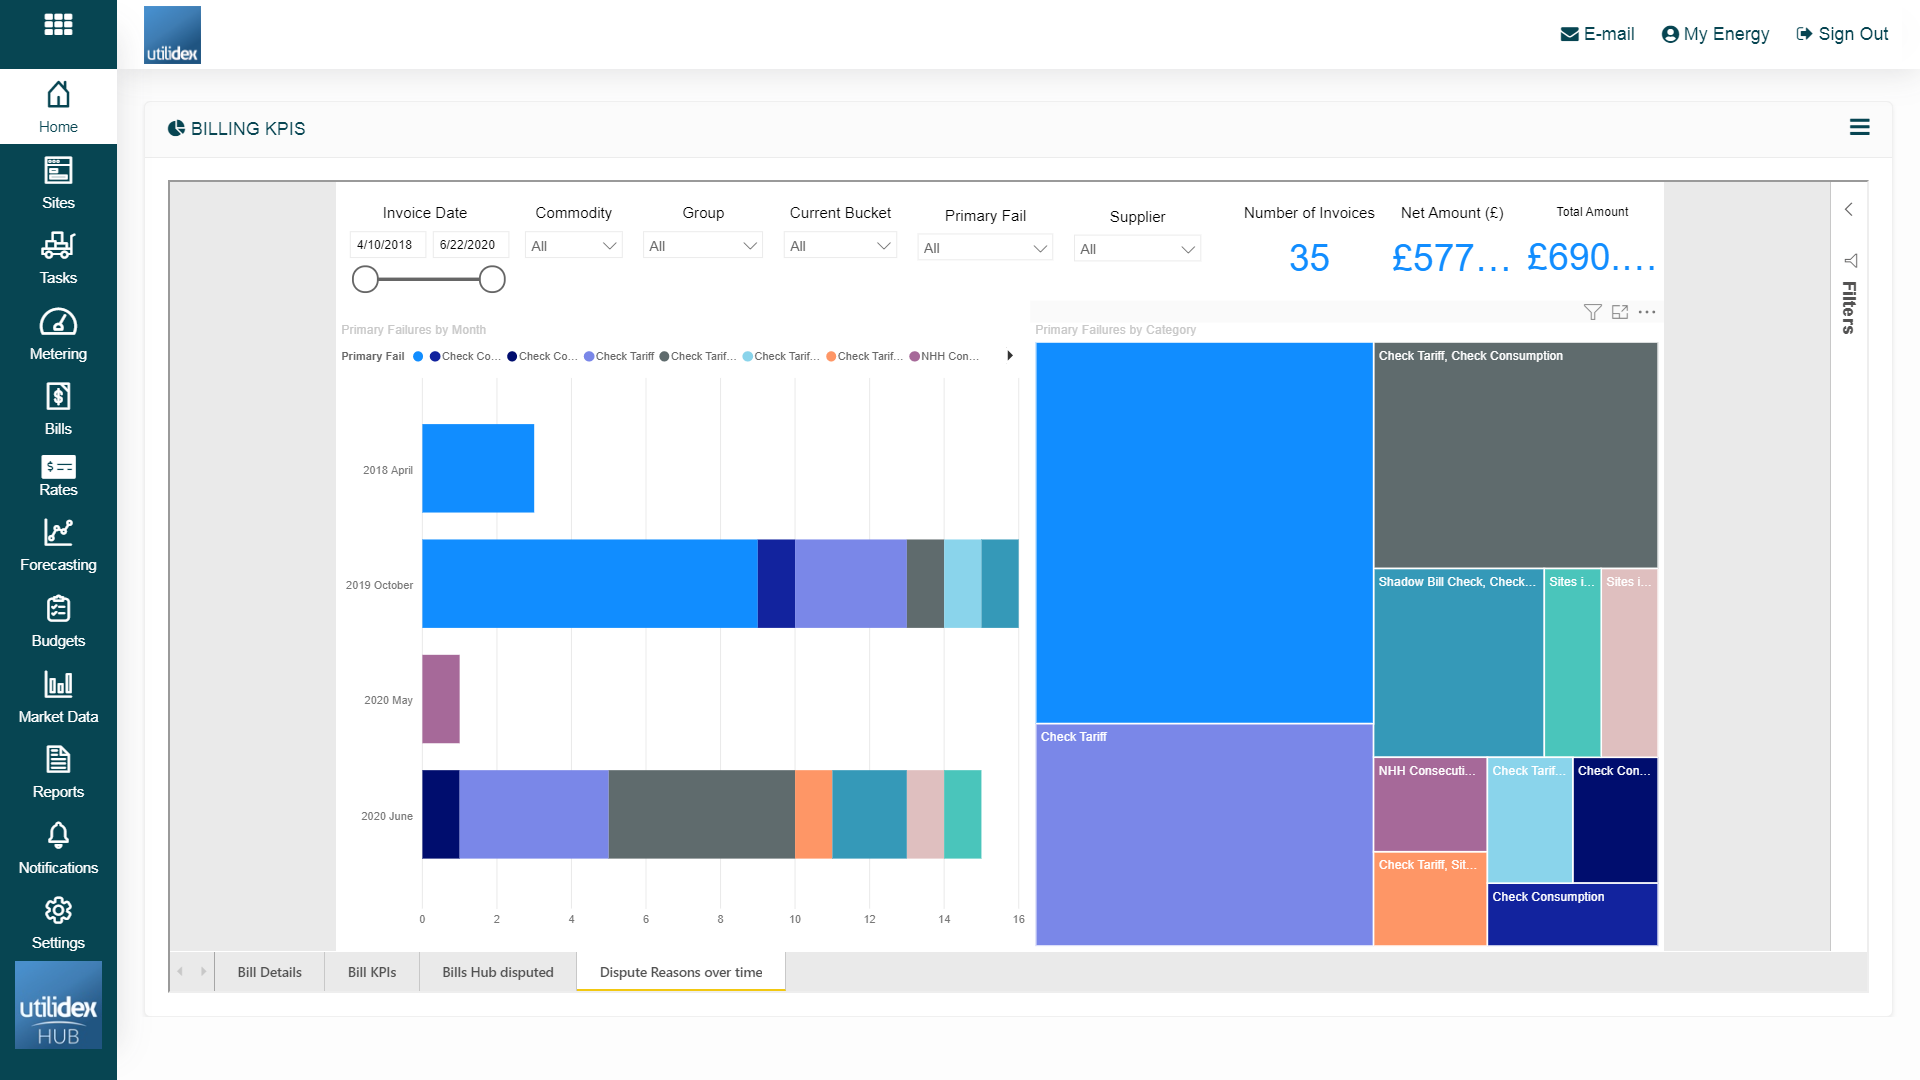
The Billing KPI dashboard provides useful information for the Billing Manager, Finance Manager and Procurement Specialists. Below is a screenshot of the current version within the Energy. Hub which can be found by navigating to Home >> Hub BI >> Billing KPIs.
Just as displayed in Excel, there are four different worksheets contained within the report:
- Bill Details
- Bill KPI’s.
- Bills Hub Disputed
- Dispute reasons over time
Here you can view the data, and can compare and filter using the below parameters:
- Invoice Date Range
- Commodity
- Group Name
- Payment Status
- Supplier Name
For business users, the dashboard answers the following questions:
- What is the total number of invoices for my filter criteria?
- What is the total consumption in KWh?
- What is the Average PPU?
- What is the Total Amount of money billed?
- What is the Net Amount by Grouping and Group?
- What is the Net Amount by Invoice Date and Payment Status?
- The summary information for the individual invoices in the bills.
This BI is very useful when you want to get KPIs regarding the invoices that have been disputed in the system and have a quick view of what are the main reasons for the disputed bills.
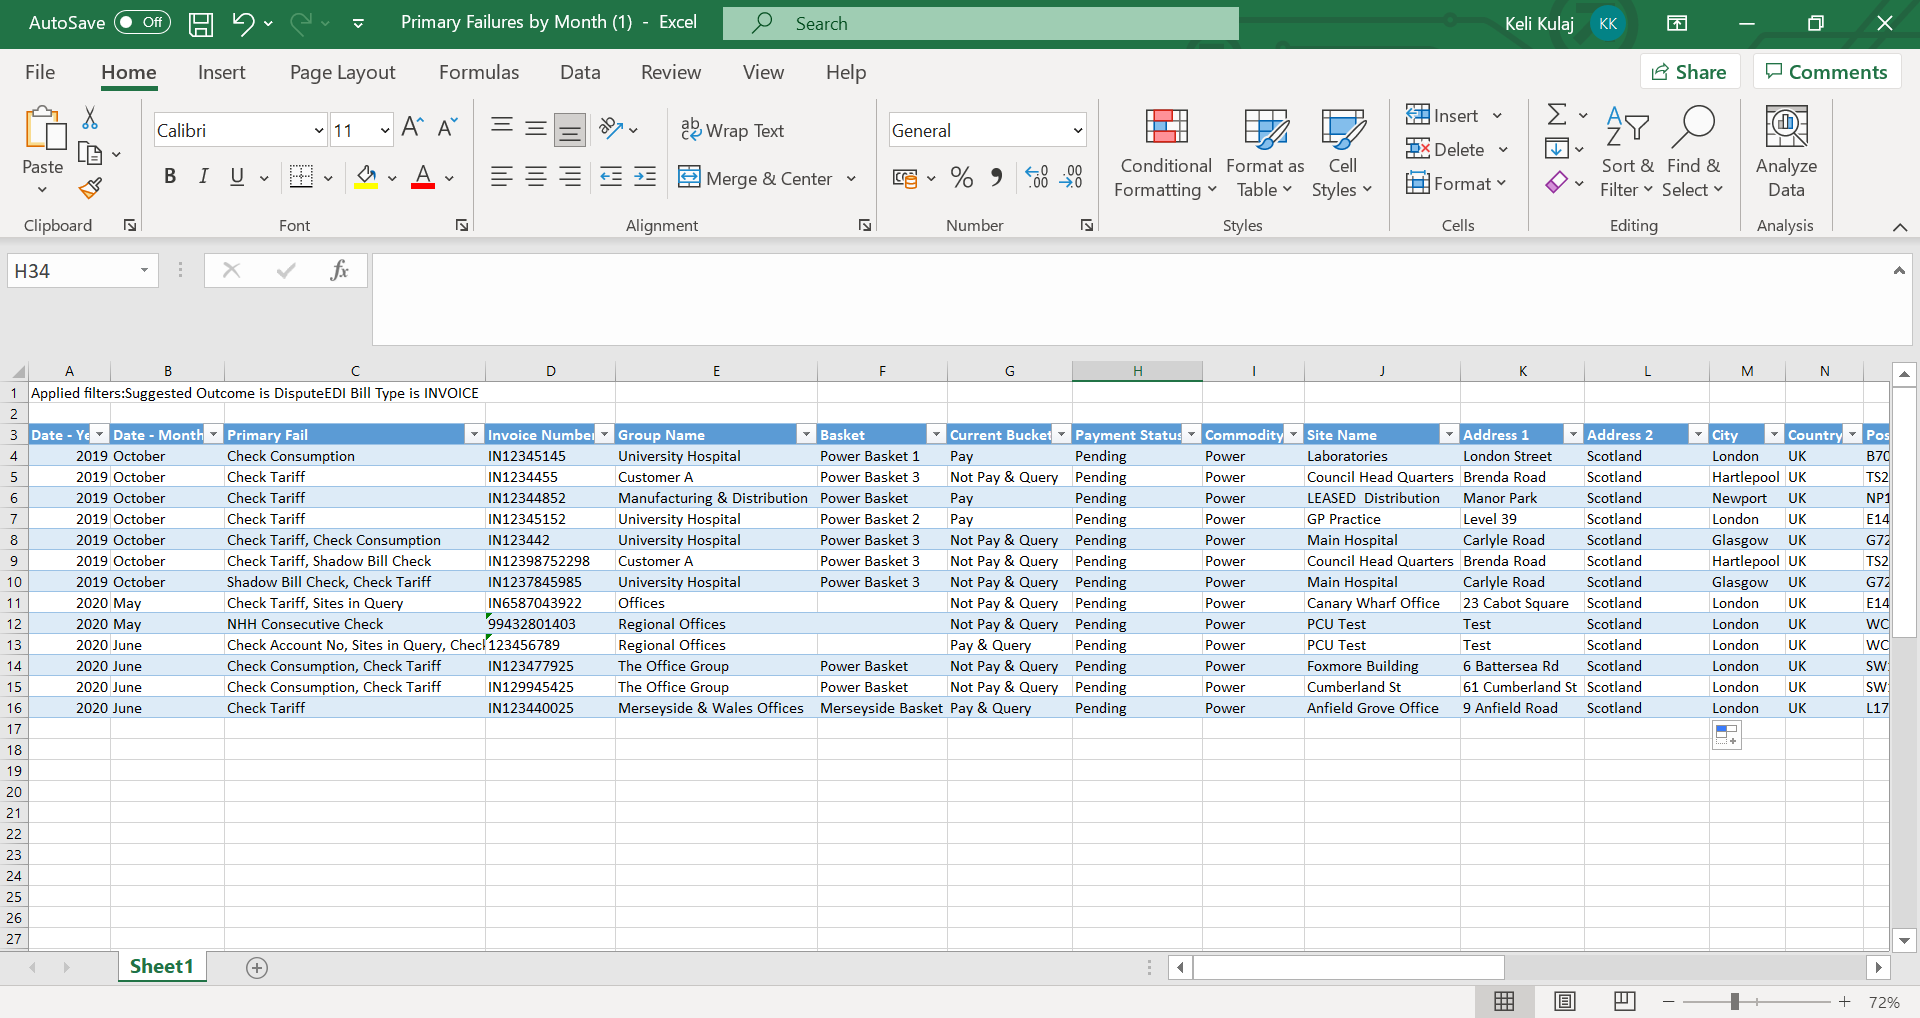
You can also download the data from the BI by clicking on the three dots on the top right corner of each table. Please follow the following path: Click on the three dots > Export Data > Underlying Data > Export. Please see below an example of the underlying data downloaded in an excel file directly from the Power BI.