Benchmarking Performance
Users can also use the Utilidex system to benchmark their performance. There is both a BI and excel report which allow for performance analysis against both the market and a pre-determined benchmark rate.
The below BI displays the Weighted Average Cost of Gas versus market benchmarks.
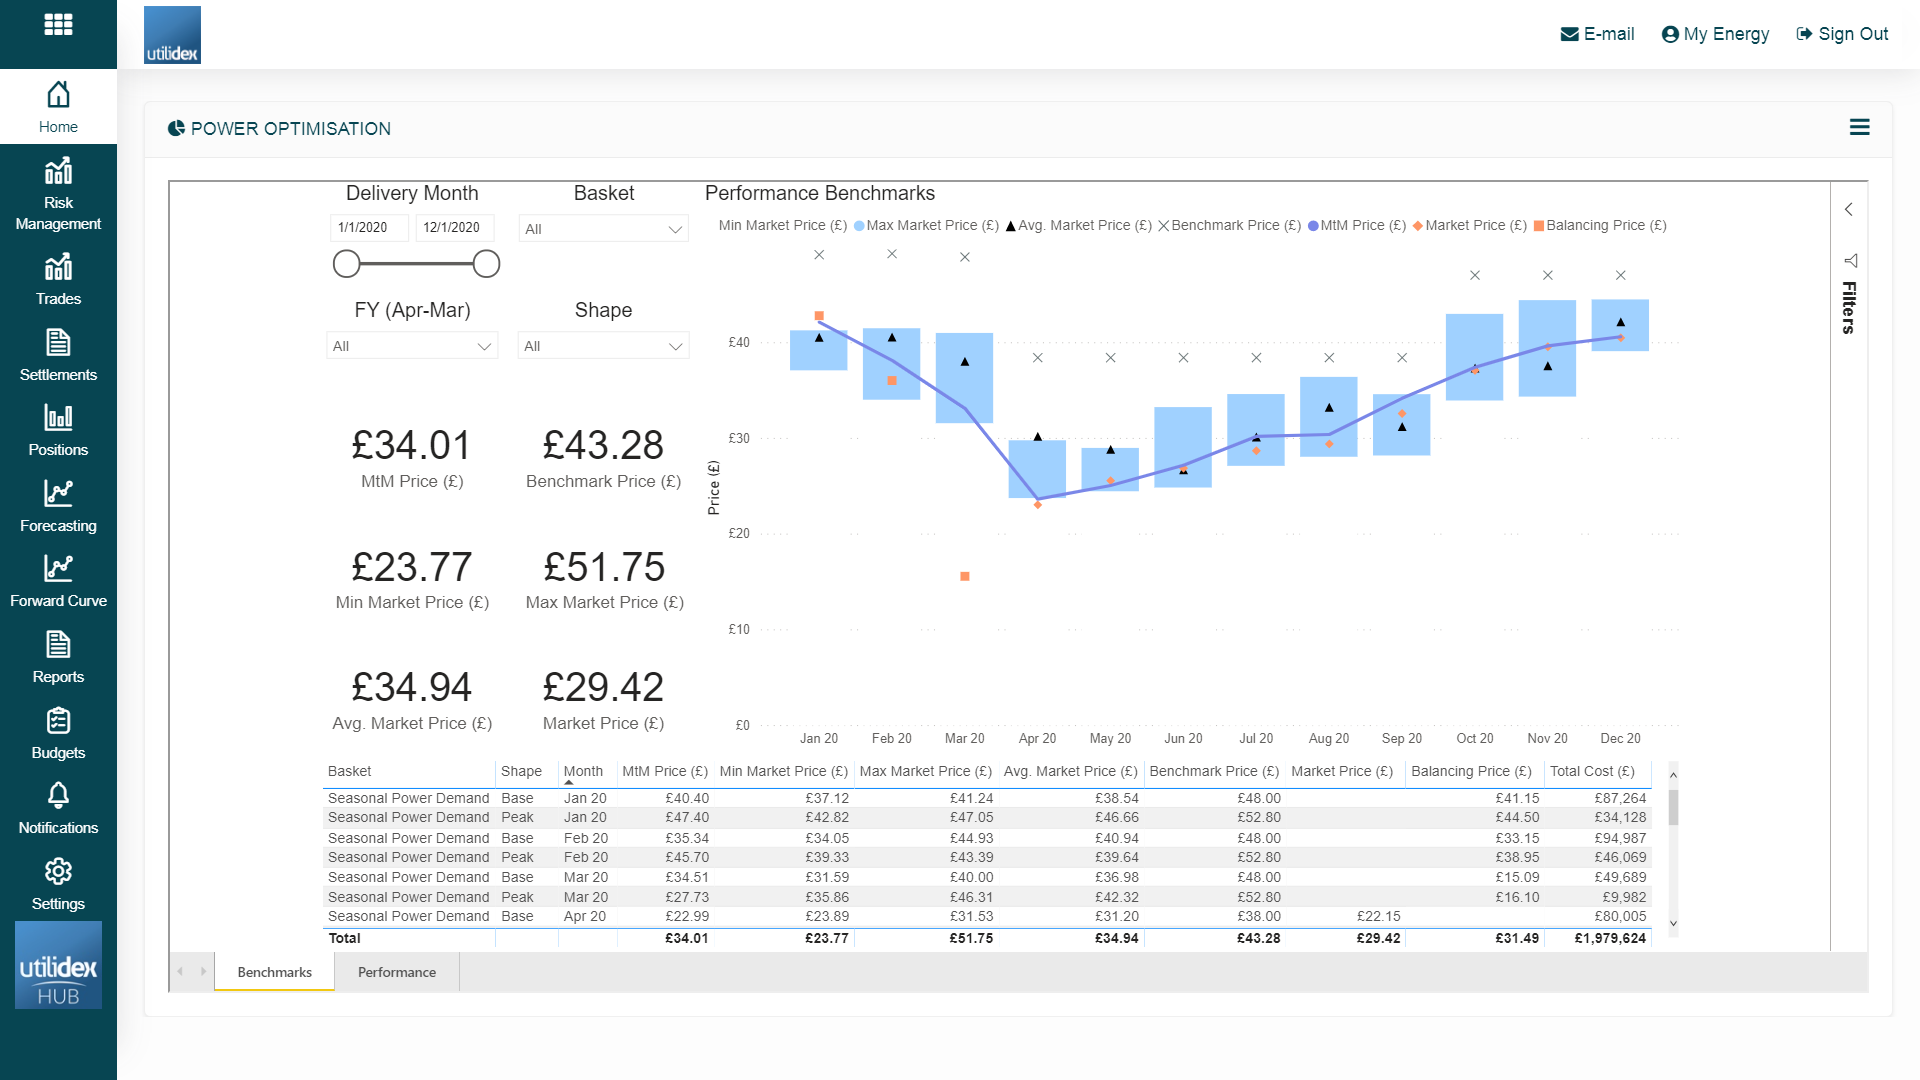
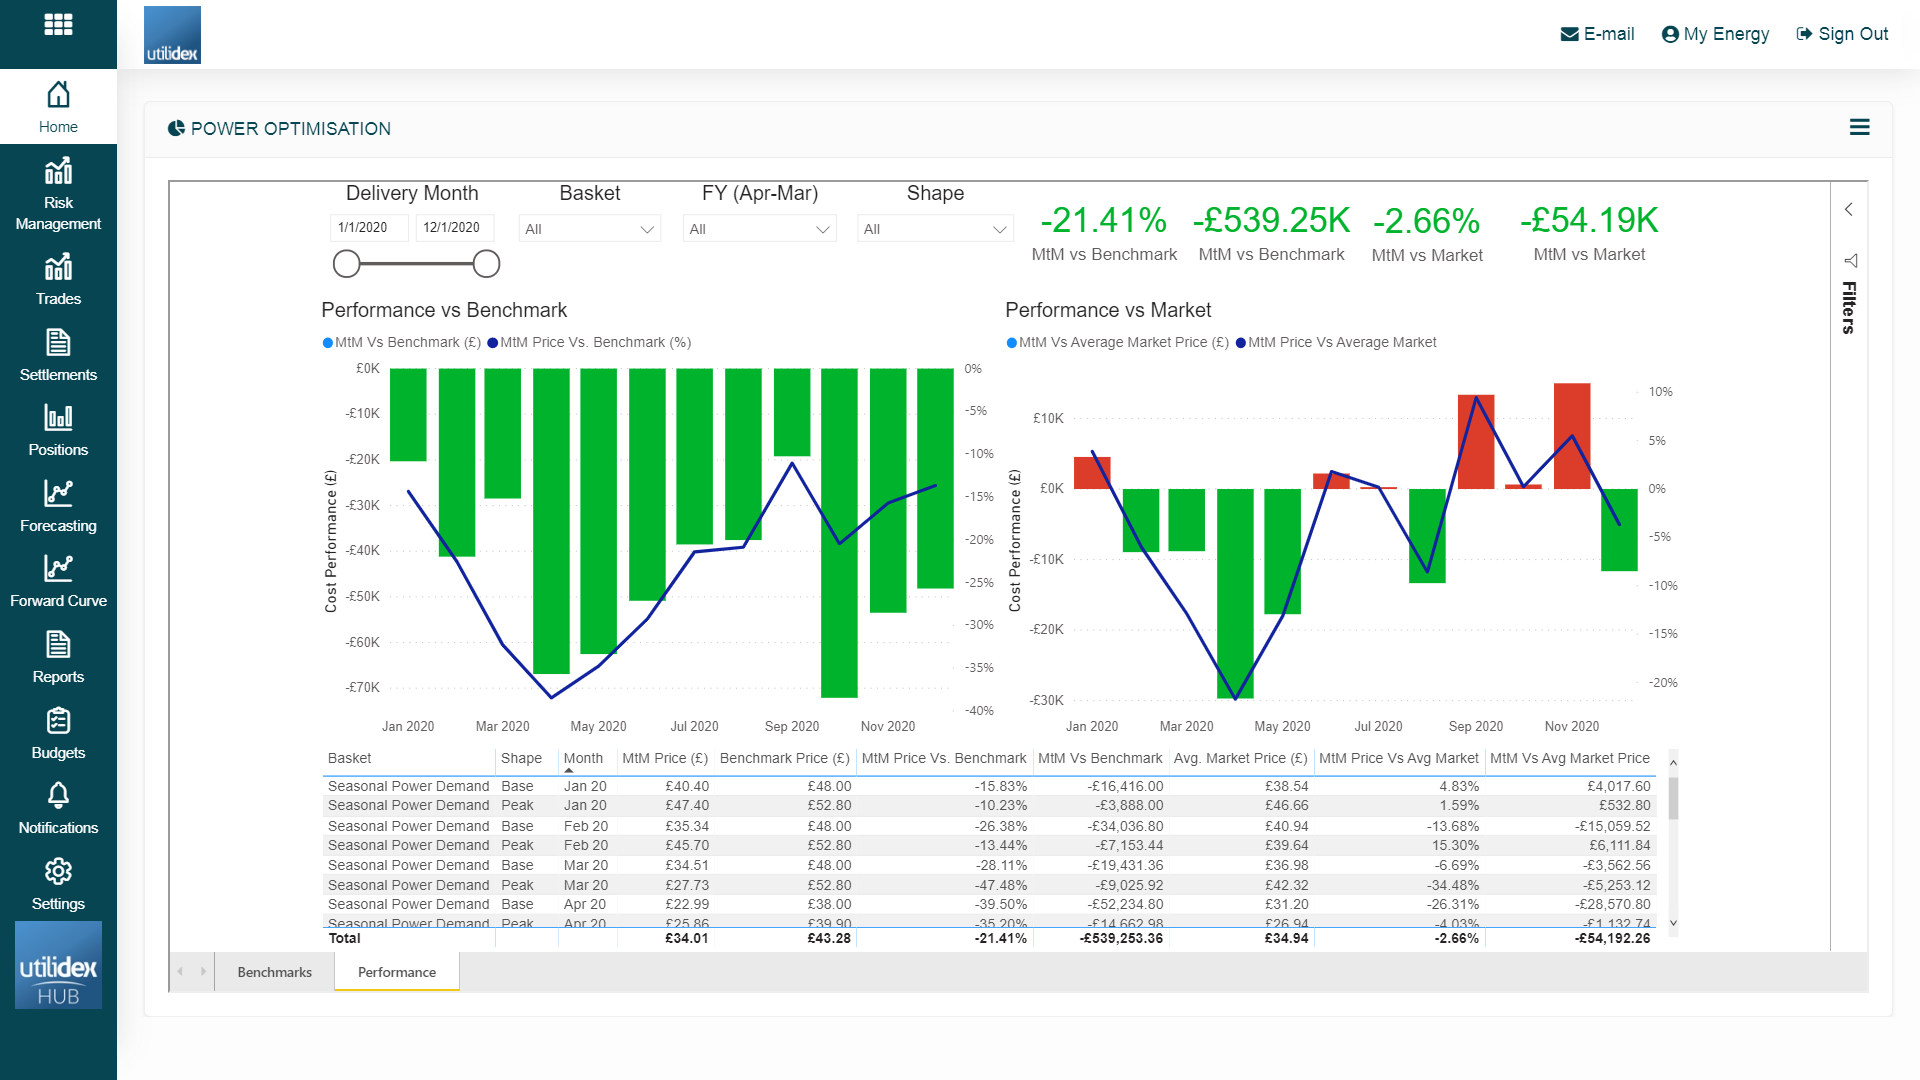
Users can also calculate a P&L (i.e. cost differences) using the achieved rate and benchmark or average price. The below BI displays the total performance benchmark by month as well as a total, this can be displayed by fiscal year. The values are calculated by comparing the total cost vs. what this would have been if the benchmark price or average ICE price was achieved.