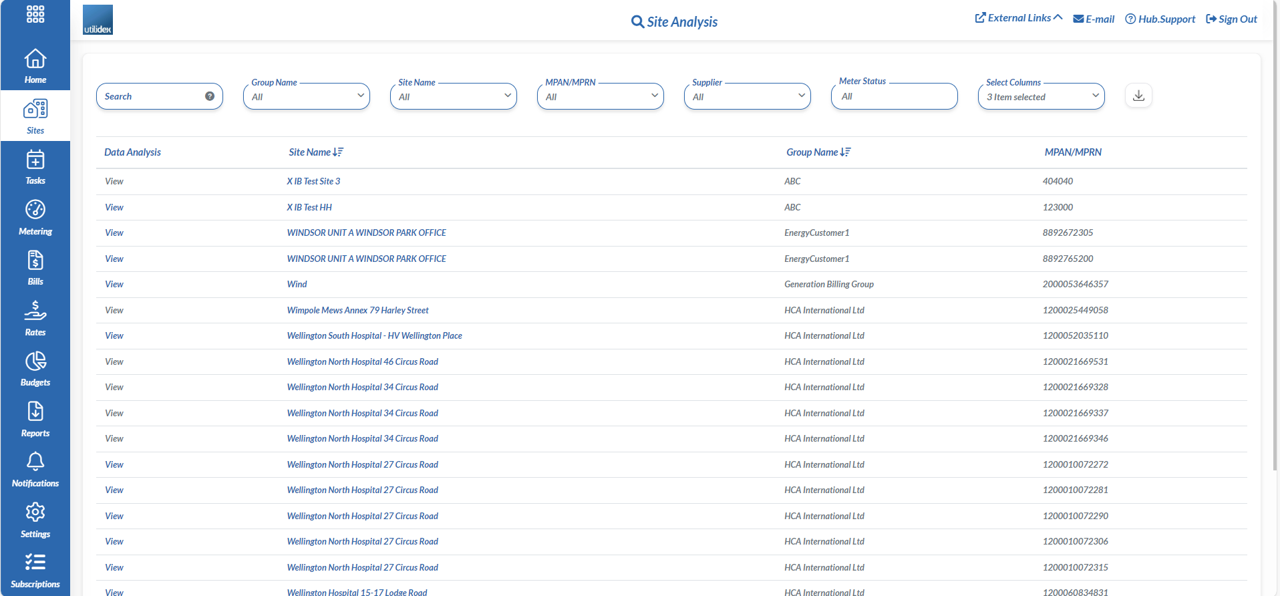
Ensuring your standing data is kept up to date is essential for being able to perform all the activities in the Hub. To view your data portfolio, navigate to Sites >> View Site List.
The site list is a versatile tool that allows you to search for either sites & meters, or search for a specific field type. You can then select the site in the Site Navigation column.
Site CRM
Once you select a site, you will be directed to the main section for the site search.
There are five tabs on the top of the Site CRM as summarised below, and detailed further on:
- Overview: view what services (power, gas, water) are connected.
- Services: view all the market data in one place (connection details, market participants, etc).
- Metering: view all the meter data in one place.
- Accounting: view your EDI bills/supplier bills and Hub generated bills.
- Actions & Tasks: enter call logs, raise site queries, see all the latest changes & updates on the site, add Manual Bills.
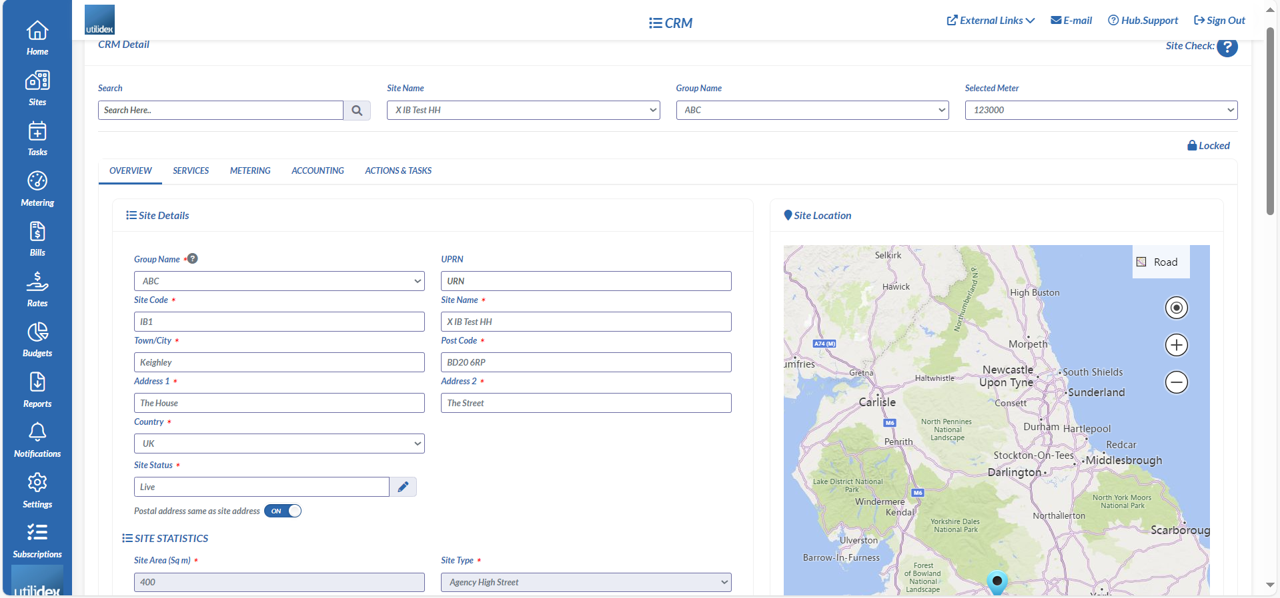
If you want to navigate to other sites directly from this screen you can use the search box at the top left corner of this screen. The search works on the following CRM fields:
- Meter ID
- Site Name
- Group
- Address
- Site Code
- Site Reference
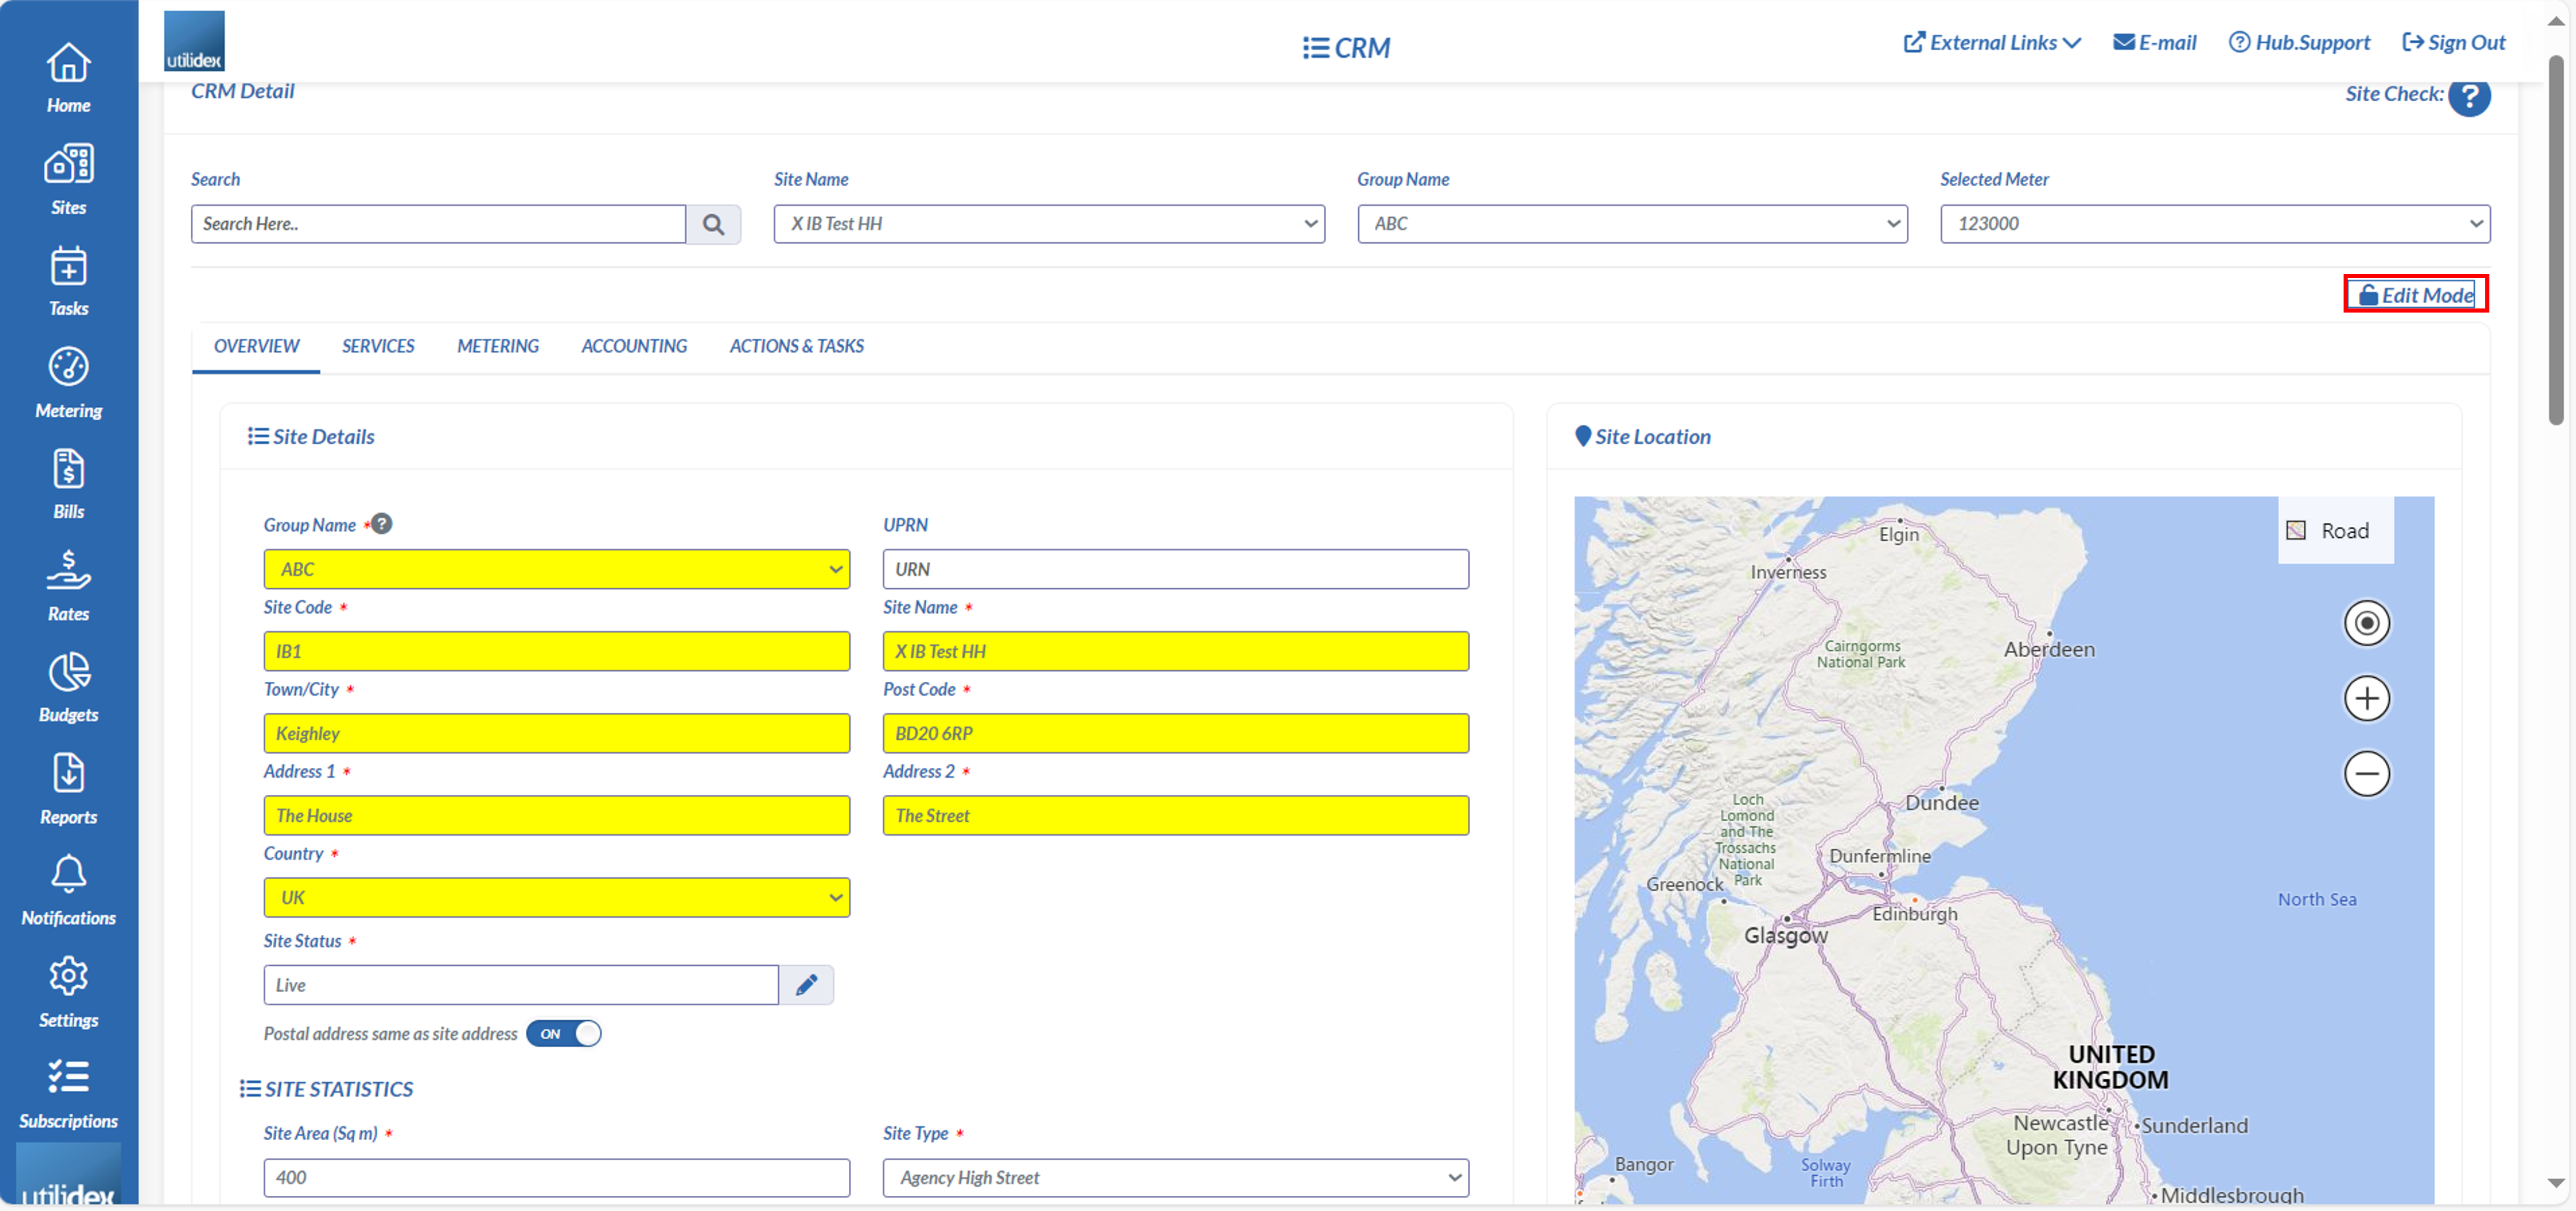
By default, the site is locked and not in edit mode. This helps to stop any inadvertent changes to data that you could make as you were clicking around. If you wish to make changes to the data (and assuming you have the permissions to) you can click on the Edit Mode on the top right section of the screen, and then the fields which you can edit and amend will be highlighted in yellow. The edit button applies to all tabs of the CRM site management screens.
Data Versioning
Utilidex Energy.Hub has the ability to address the versioning of data, this is particularly applicable during billing cycles, as updates to the standing data can impact the invoice validation. This could be, for example, a site reference number that changes during the meters lifespan, or a tariff that has been changed periodically.
To address this, you will notice throughout the site CRM screens that some of the input boxes have further click through sub-menus as indicated below, these are accessed by pressing the pencil mark at the side of the input box. If this is the case, the system will prompt you to enter the data and apply a ‘too and from’ date range. This is how the system handles, and stores versions of data.
We will now analyse the different tabs available in the Site CRM screen.
Overview
The site overview screen provides information on the sites name, address, group and what connected services the site has. It also contains a location map which is driven by the address fields.
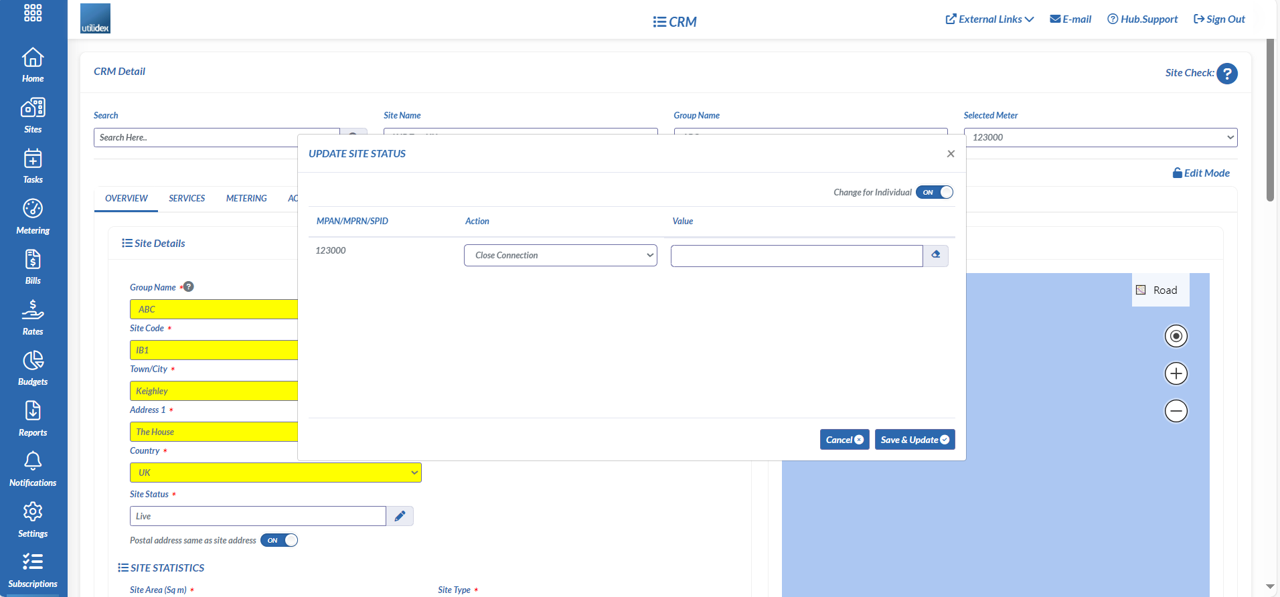
Within the site details, the site status field allows administrative users to close the entire site, individual meters, or move a meter (including all of its data) to another site within your portfolio. You can apply the connection status of the entire site (open or closed) and apply a date, or you can select individual meters to manage. The below is a screen capture of the window that appears where you can configure and update these settings.
Additional site specific information such as the site type such as office, warehouse etc, and site area can be added which will drive other areas of reporting within the Energy.Hub. You can also apply the site opening and close times, and add holiday closures for advanced functionality in the identification of vacant energy.
These are then used to determine the consumption and energy intensity for the given site and improve energy efficiency.
Vacant energy
The Energy.Hub has a tool for managing out of hours “Vacant” energy consumption and highlighting saving opportunities. This allows you to apply open and close times and holiday opening hours/closures, which in turn then provide alerts when tolerances are breached.
By navigating to the site Overview screen in the site CRM, you will find the site statistics section, you can enter the physical details of the site such as the default Site Type, Site Area and the working hours.
You can apply the default opening and closing hours by switching on the check box Default, alternatively you can enter a custom calendar by switching the check box off and entering the information manually.
To configure the default opening and closing hours, please click Configure Defaults and enter the default hours.
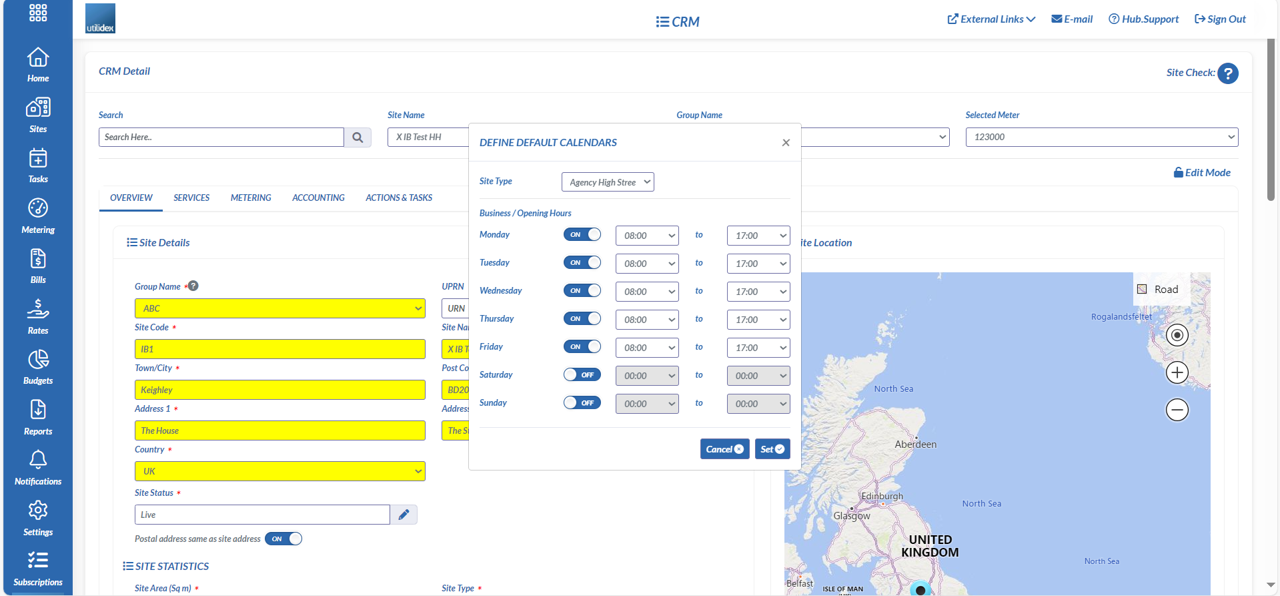
You can also enter holidays for the given site by clicking on Configure Holidays. In the Configure Holidays/Shutdowns screen, you can amend and add holidays one by one.
You can run vacant energy reports for a whole month, as well as receive alerts via email if sites breach limits, so that they can stop/correct vacant energy faster.
Services: Reviewing power, gas and water market data
The services tab, is where you’ll find all your sites Power, Gas & Water data in one place. You can select the tabs on the right hand side to view either power, gas or water.
In the below example, we have power selected and are viewing the power data:
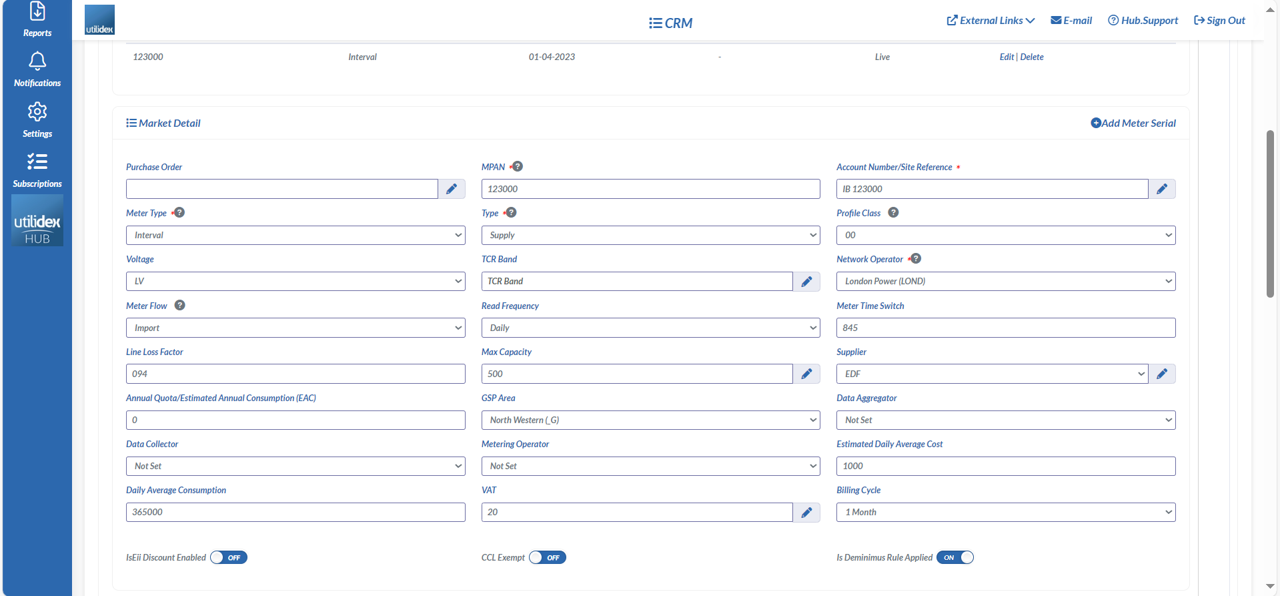
The screen is split into a number of different sections, as detailed below:
- Market Connection Details: These are the MPANs & their respective Start/End Dates for the site. You can also de-energise the meter.
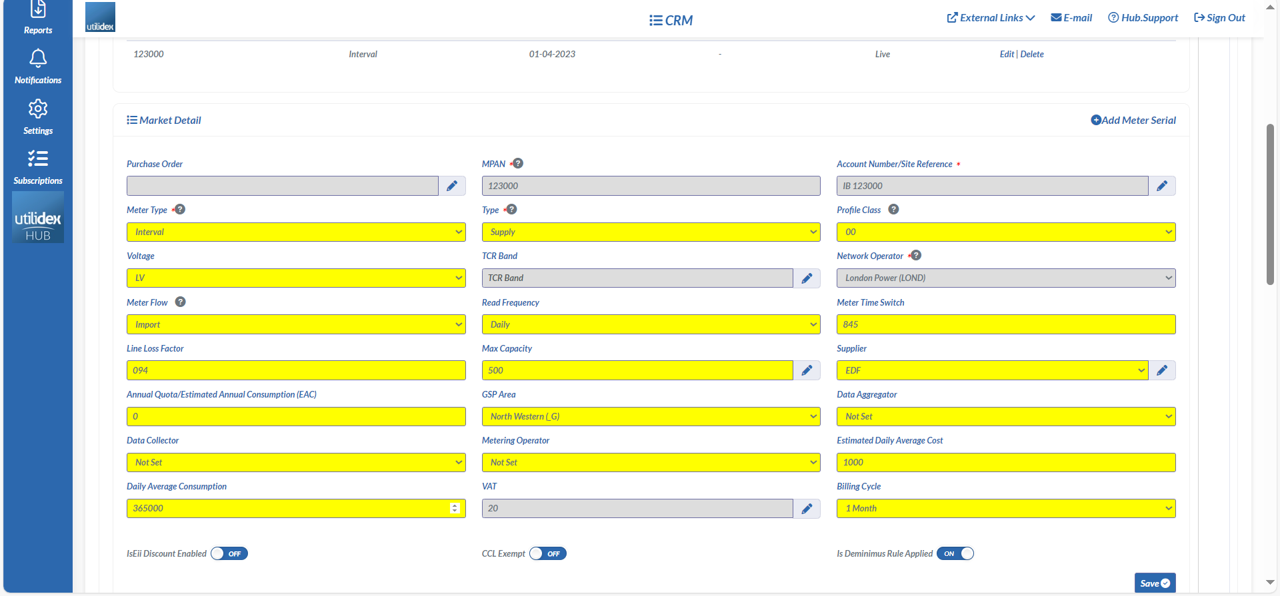
- Market Detail: for each MPAN/MPRN/SPID that is selected in the top section, this section details the key data items for the site, such as supplier, network tariff, Max Capacity, LLF Code, GSP Area, meter type & read frequency. Each of these settings has a downstream impact, so it’s important to make sure they are correct. MPAN’s/MPRN’s/SPID’s can be updated in the system if there isn’t any existing data (billing, COT’s, Tasks etc.), the Hub will only allow you to update this field if this is the case.
- Contract Details: This section details the tariff, the components and charge rates for the site. To learn more about how the billing/validation engine works, please see the section on billing.
- VAT: You can change your VAT rate within the services user interface. We also provide the ability to add an automatic de minimis rule in-line with the regulation for low volume meter consumption*. To turn this on you will need to make sure “Is Deminimus Rule Applied” is ticked.
*For further information on the VAT rates for low volume consumption meters, please see the following article: https://www.gov.uk/government/publications/vat-notice-70119-fuel-and-power/vat-notice-70119-fuel-and-power#electricity
By default, services is locked and not in edit mode. This helps to stop any inadvertent changes to data that you could make as you were clicking around. If you do wish to make changes to the data (and assuming you have the permissions to) you can click on the Edit Mode on the top right section of the screen, and then the fields which you can edit and amend will highlight in yellow for you to change. Here you can edit VAT, site reference and meter operator etc. The fields that allow editing are highlighted in yellow as shown below.
Metering: Reviewing meter data
This screen simply shows the meter data for the site. You can change the date range that you wish to look at.
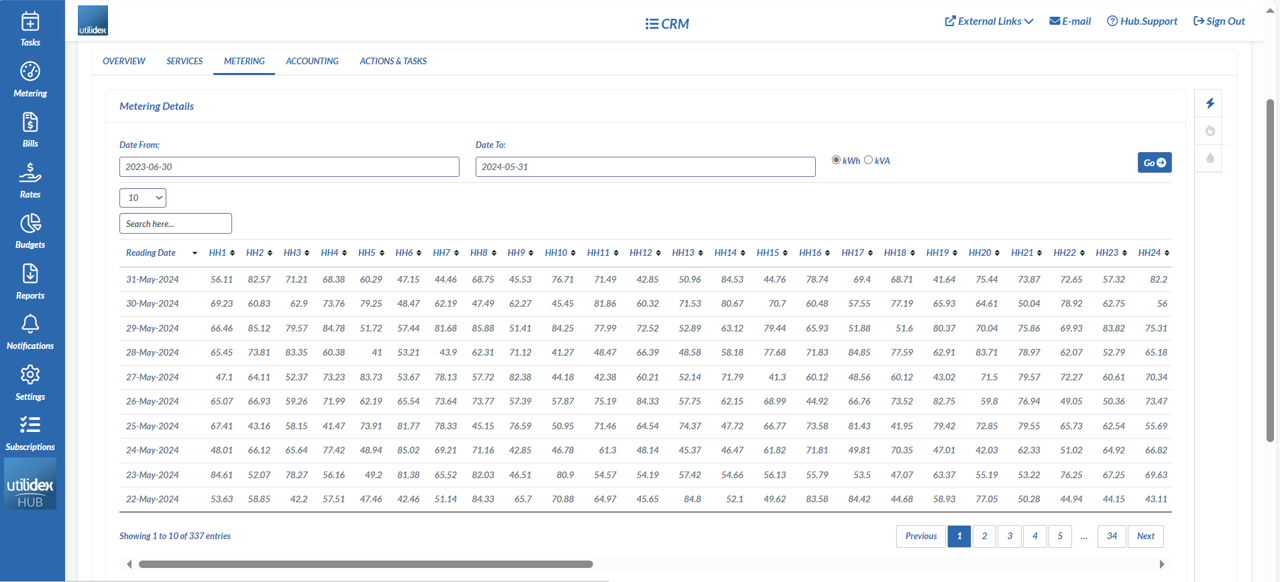
If you want to see a graphical representation of this data, or view the comparison chart, you can click on Site Analytics and it will take you to the graphical view of the data.
Accounting – Reviewing bills
Depending on your subscription, you could have several bills to view within this screen. Some customers (retailers) use the Hub to generate their invoices. Whilst other customers (consumers, generators) use the hub to validate their invoices. So there can be two sets of records here, being the bill the energy supplier sent (either via EDI or XLS) as well as the invoice the hub generated in order to compare the bill.
If you are a customer that has both (supplier bill, plus hub bill) then a drop-down will be made available in the this screen, so that you can toggle between viewing one, the other or all at the same time. You can also (if you wish) print out a PDF invoice from this screen, by scrolling to the right of the screen.
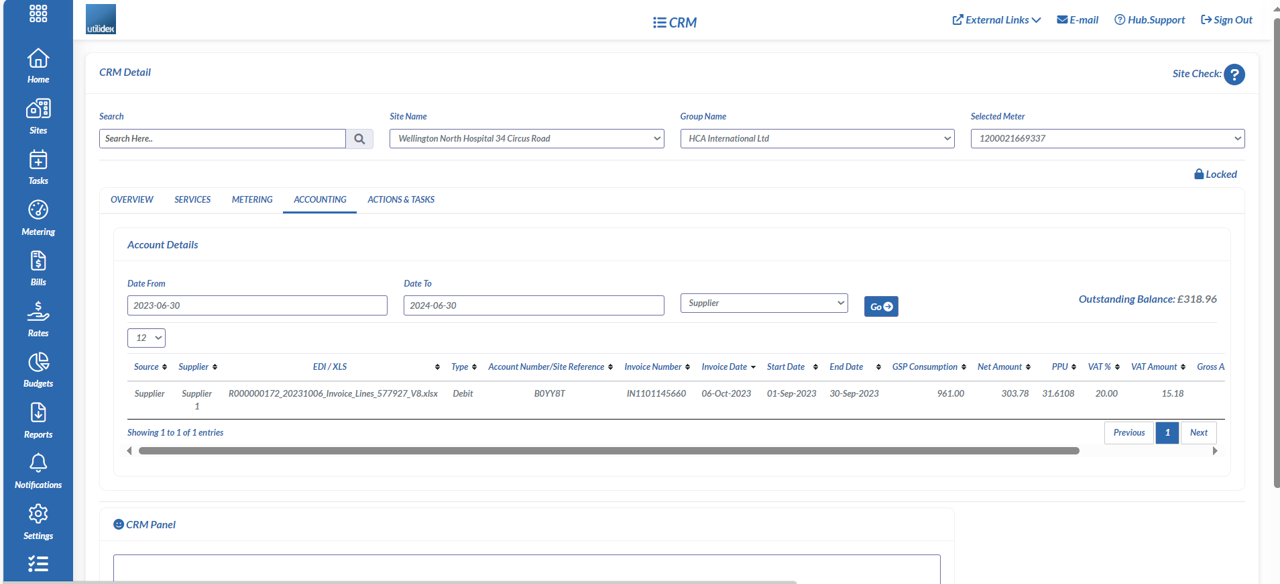
Some users wish to display only one bill type, either the Utilidex shadow generated bill or the supplier’s which is derived form the EDI message. You can make this change through the filters available in the Account Details section.
Actions and Tasks – Managing sites
Sites may at times have problems with them, which need managing between you and other parties. For instance, there could be a faulty meter, a change of tenant, or problem with the bill. The Actions & Tasks section helps you manage these activities, so that you can easily track what is happening, and where necessary put a hold on certain downstream activities, for instance you might want to hold paying the bill.
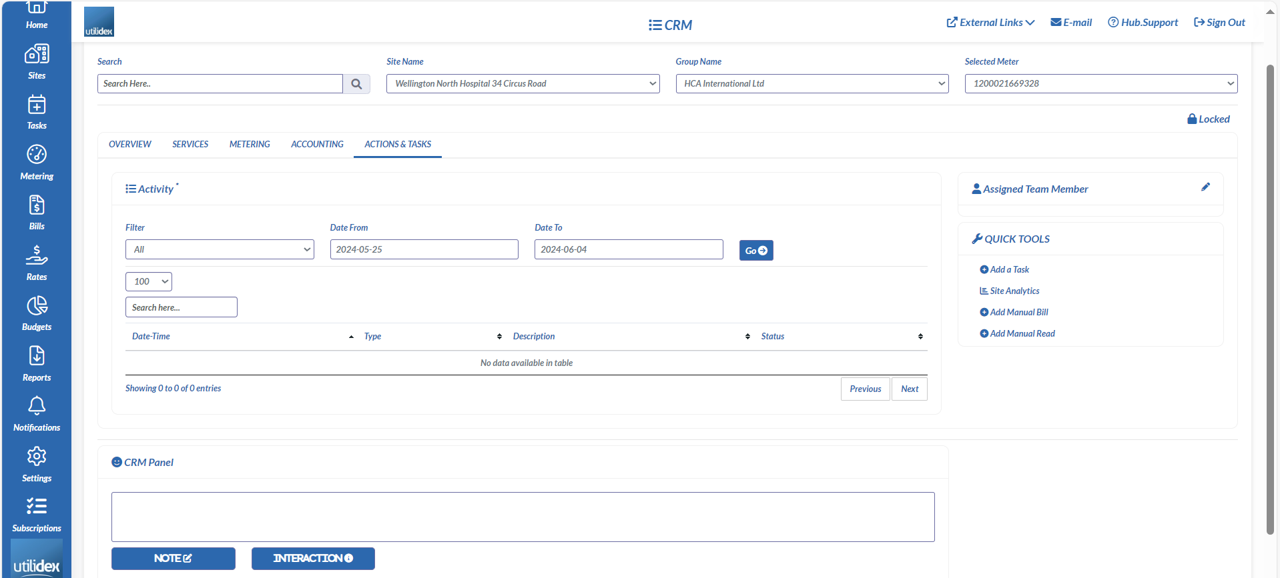
There are multiple actions that can be applied through the quick tools menu located to the right of the screen, from here you can do the following:
- Add a task: here you can add tasks to be carried out by you or your colleagues.
- Change site checks: here you can apply health checks to the individual site.
- Add Manual Bill: Here you can add manual non-contract bills which can then be run through the validation engine. The user can capture the billing details and also attach the Pdf bills to the manual input for reference. The reference documentation is then viewable from the CRM accounting screen as described earlier in this content.
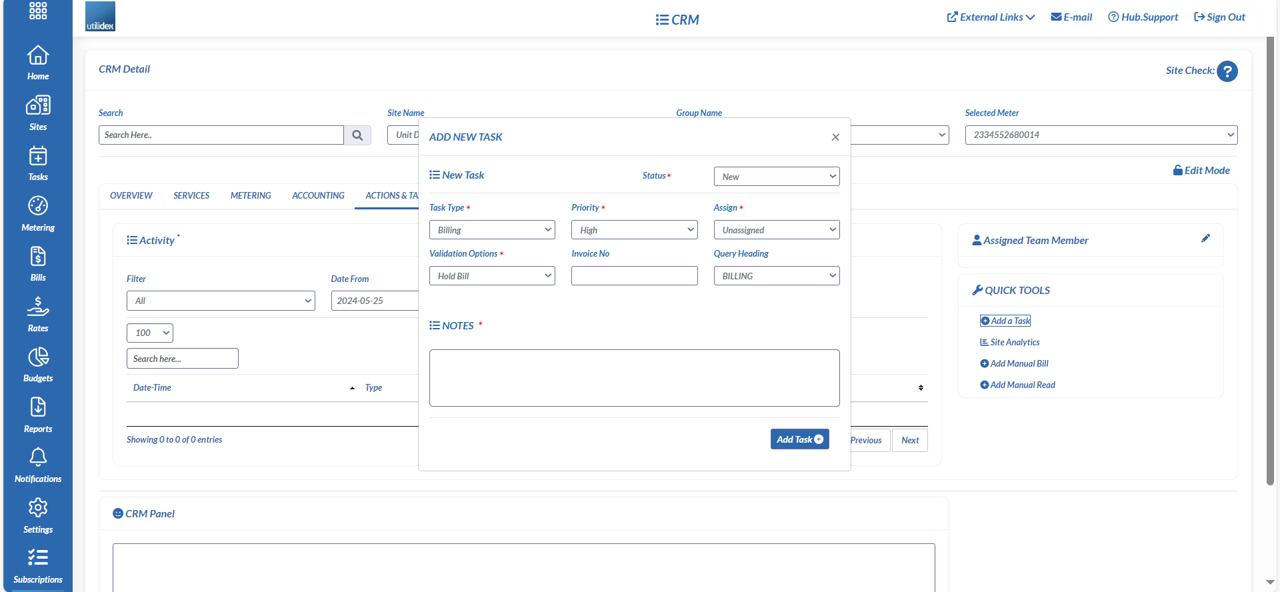
- Process a COT: In the below example we have opened up the actions and tasks screen, and then clicked on Edit Mode (to allow us to make changes) and then clicked on Add a task. Within this screen, we can add a billing task, meter task and assign it to Users within the system.
